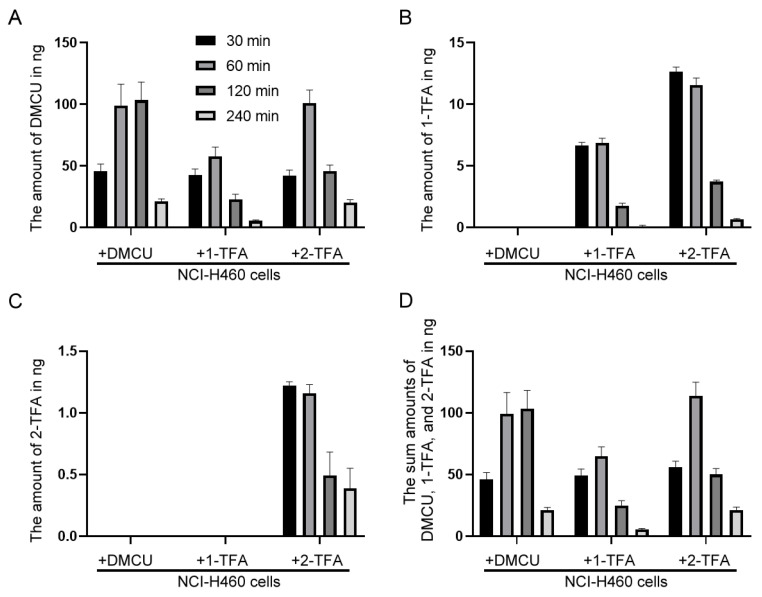
Figure 4.
The intracellular levels of DMCU, 1-TFA and 2-TFA in the NCI-H460 cells. The cellular extracts were obtained from DMCU, 1-TFA, or 2-TFA treated cells at the indicated time intervals. The amount of drug uptake, (A) DMCU, (B) 1-TFA, (C) 2-TFA, or (D) sum amounts of DMCU, 1-TFA, and 2-TFA, was evaluated in the cellular extracts of approximately 1 × 10⁶ cells by LC-MS analysis. Data are presented as mean and SD from three experiments.

