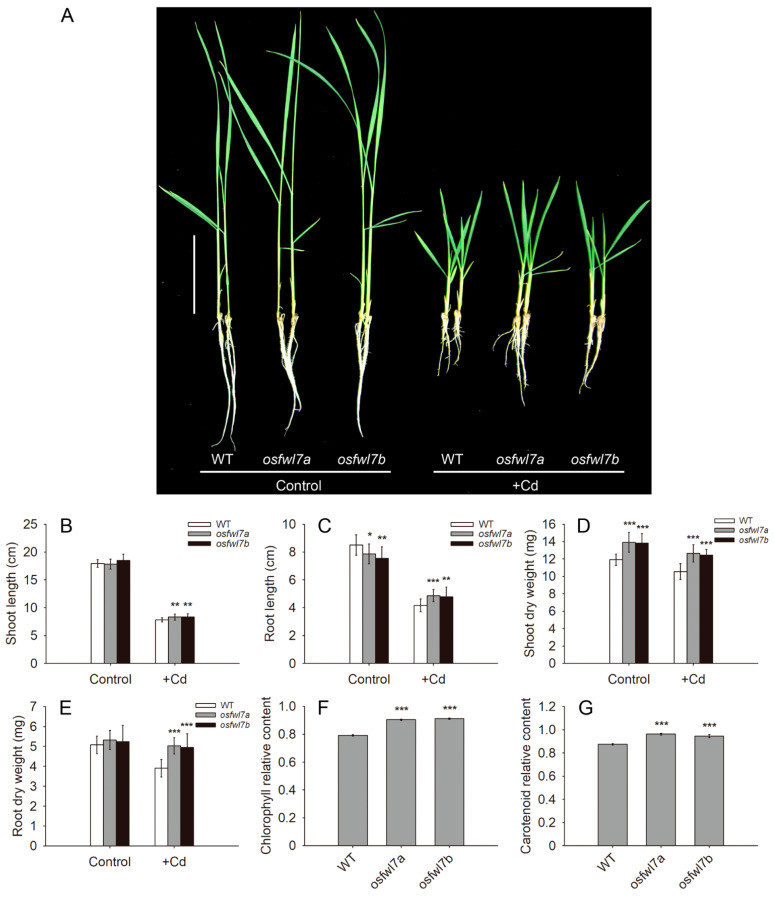
Figure 2.
Performance of the wildtype (WT) and osfwl7 mutants under Cd stress. (A) WT and mutant plants grown under normal conditions and in the presence of 50 μM Cd for 10 days, bar = 5 cm. (B–E) Shoot length (B), root length (C), shoot dry weight (D), and root dry weight (E) of the WT and mutants, n = 15. Error bars indicate standard deviation. (F) Relative chlorophyll content of the WT and mutants (chlorophyll content under Cd stress/chlorophyll content under normal condition). (G) Relative carotenoid content of the WT and mutants (carotenoid content under Cd stress/carotenoid content under normal condition). Error bars in (F,G) indicate the standard deviation of three biological replicates. * p < 0.05, ** p < 0.01, *** p < 0.001.

