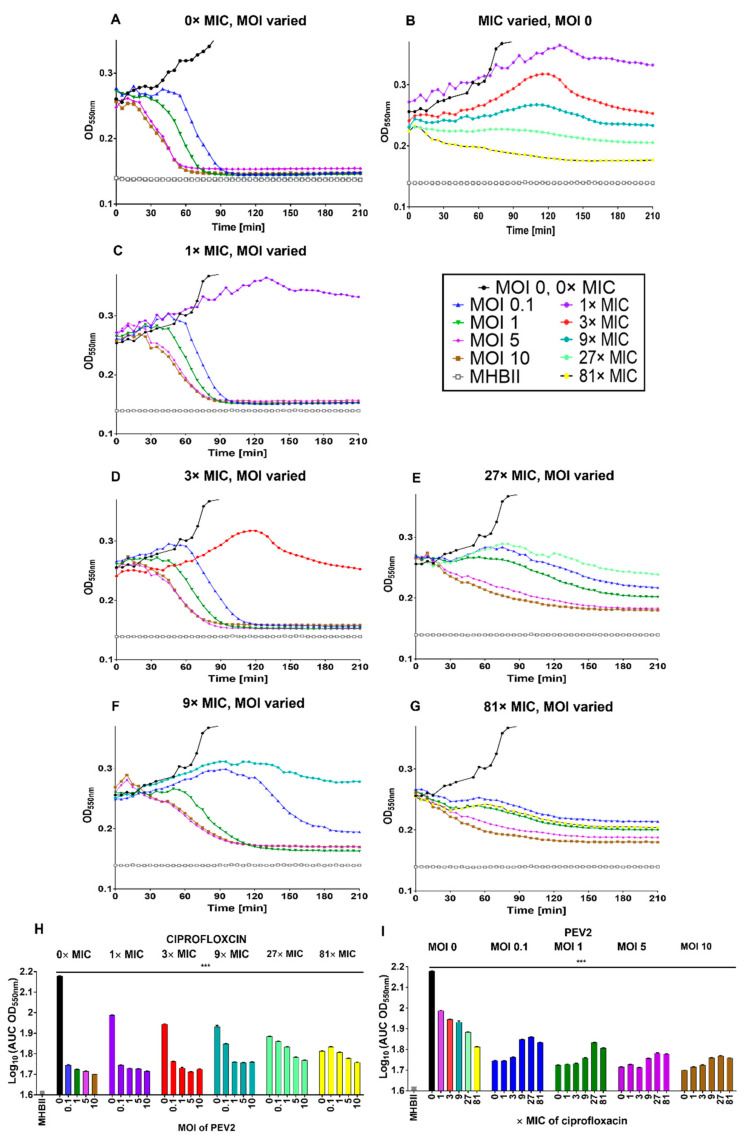
Figure 3.
Ciprofloxacin low antagonism of phage PEV2 infection of P. aeruginosa. (A) Phage PEV2 behavior in the absence of ciprofloxacin and impact on P. aeruginosa PAO1 cultures. (B) Impact of different concentrations of ciprofloxacin on P. aeruginosa PAO1 cultures without phage. (C–G) Impacts of 1×, 3×, 9×, 27× and 81× MIC concentrations of ciprofloxacin, respectively, at various phage PEV2 MOIs including no-phage ciprofloxacin controls. (H,I) Area under the curve analysis of PEV2 infection with ciprofloxacin as derived from lysis-profile experiments equivalent to those presented in (A–G). A key is provided in the black frame. Error bars represent standard deviation between samples. See Appendix A for explicit ciprofloxacin concentrations used and Appendix B for interpretation of lysis profile results. A single representative experiment is shown. [***] p < 0.0005, ANOVA. These experiments are indicated in this figure over a longer time scale than that used in Figure 2 due to the greater variation between curves seen later in infections with ciprofloxacin vs. colistin treatments.

