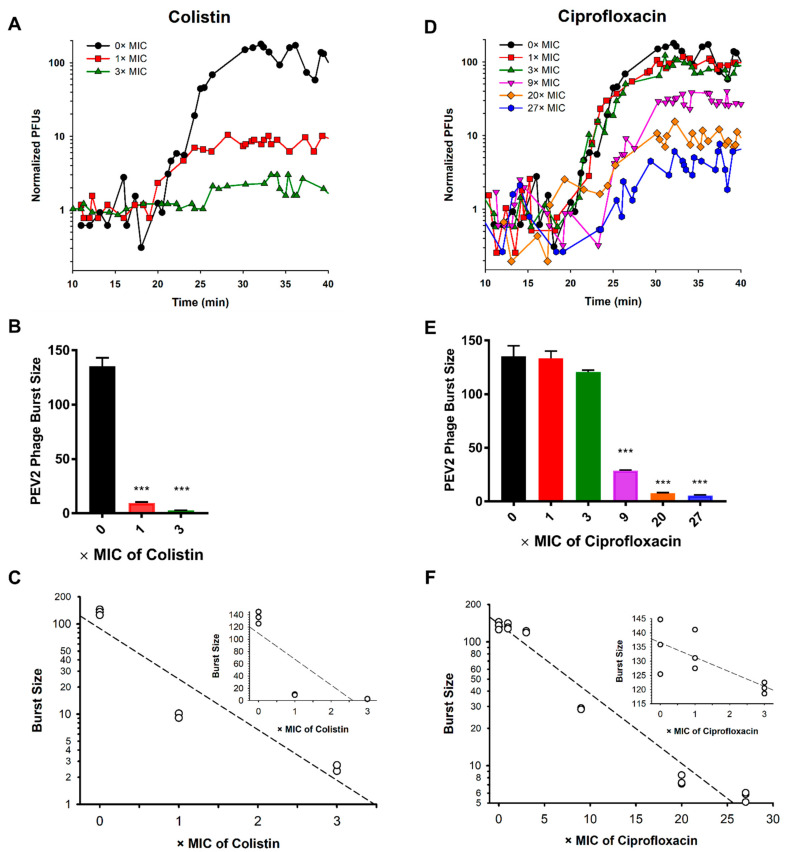
Figure 6.
PEV2 one-step infection cycle characteristics in the absence or presence of antibiotic. Shown are one-step growth curves of phage PEV2 infection (MOI 0.05) in the absence or presence of either colistin (A) or ciprofloxacin (D), in both cases with numbers of PFUs normalized so that the average initial numbers of phage-infected bacteria for all curves are set to 1.0. Graphed in the second row are phage PEV2 burst sizes determined in the absence or presence of different colistin (B) or ciprofloxacin (E) concentrations. Error bars represent standard deviations between three experiments (biological repeats). Shown in the bottom row is the relationship between burst size and either colistin (panel (C), m = −0.561, r = 0.938) or ciprofloxacin (panel (F), m = −0.056, r = 0.982) concentrations. Inserts show burst sizes using linear scales at the first three concentrations (0×, 1×, and 3× MIC). Mean values of burst size are calculated based on 3 separate experiments. The dotted line represents a trend line. [***] p < 0.005, ANOVA, (r) linear regression, (m) slope. See Appendix A for detailed antibiotics concentrations.

