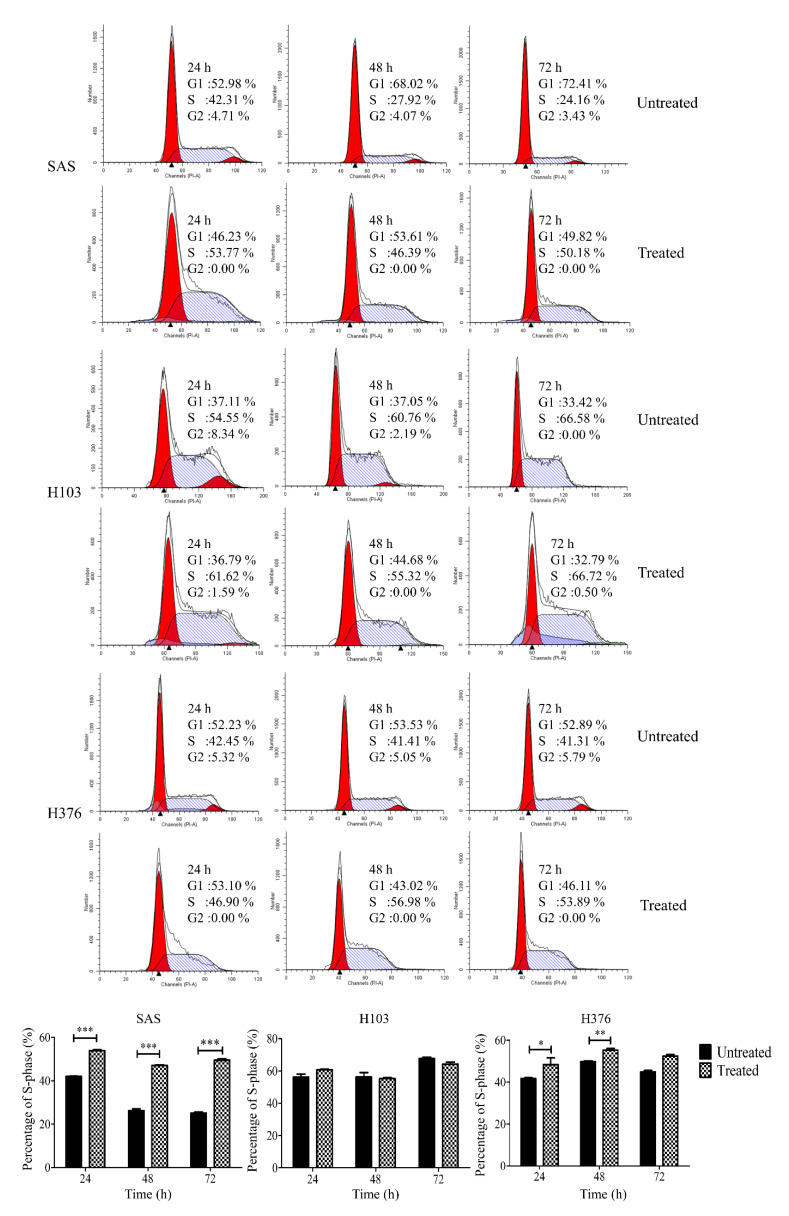
Figure 6.
Effects of a high concentration of ATP treatment on the cell cycle phases in OSCC cell lines after different time points, as analyzed by flow cytometry. The representative histograms of the cell cycle phases and the percentage of S-phase cells for both treated and untreated control groups at 24–72 h. Data are presented as mean ± SEM of three independent experiments, * p < 0.05, ** p < 0.01, *** p < 0.001.

