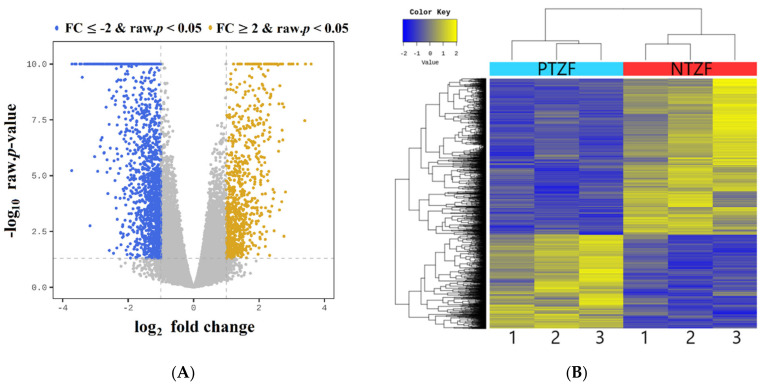
Figure 4.
(A) The volcano plot for differentially expressed genes (DEGs) of phosmet-treated compared and non-treated zebrafish (NTZF). Individual colored dots indicate upregulated (yellow, FDR < 0.05 and FC ≥ 2) and downregulated (blue, FDR < 0.05 and FC ≤ −2) genes in the phosmet-treated group; (B) heat map of differential expression in NTZF vs. PTZF. Heat map of one-way hierarchical clustering using the Z-score for normalized values (log2 based).

