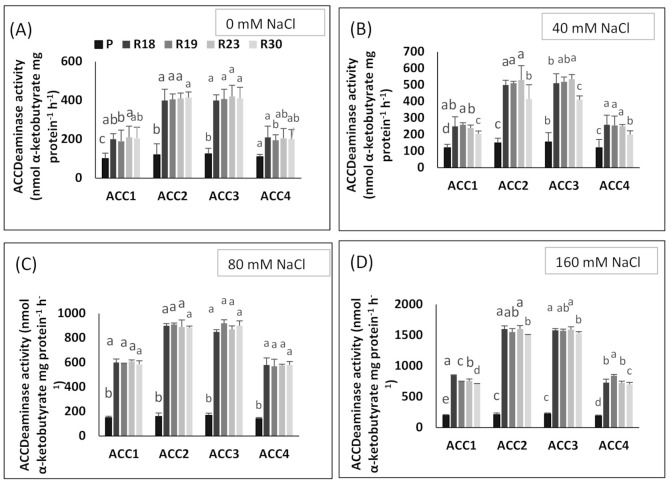
Figure 8.
Quantification of ACC deaminase activity (nmol α-ketobutyrate mg protein−1 h−1) in response to NaCl treatments of four isolates from parent and regenerant roots. 0 mM NaCl (A), 40 mM NaCl (B), 80 mM NaCl (C) and 160 mM NaCl (D). Values are means of five replicates ± SE (n = 5). Significant dissimilarities between treatments (p < 0.05) based on Tukey’s HSD test are shown by different lowercase letters.

