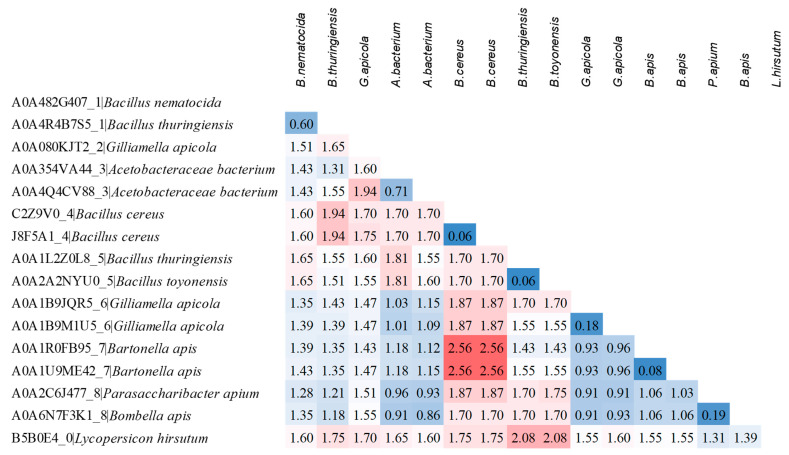
Figure 4.
Estimates of the evolutionary divergences between a selection of representative protein sequences from each cluster. UniProt ID, cluster number and bacterial species are reported for each sequence. The number of amino acid substitutions per site from between sequences are shown. The values highlighted in blue indicate the most similar sequences, while those in red the most diverse.

