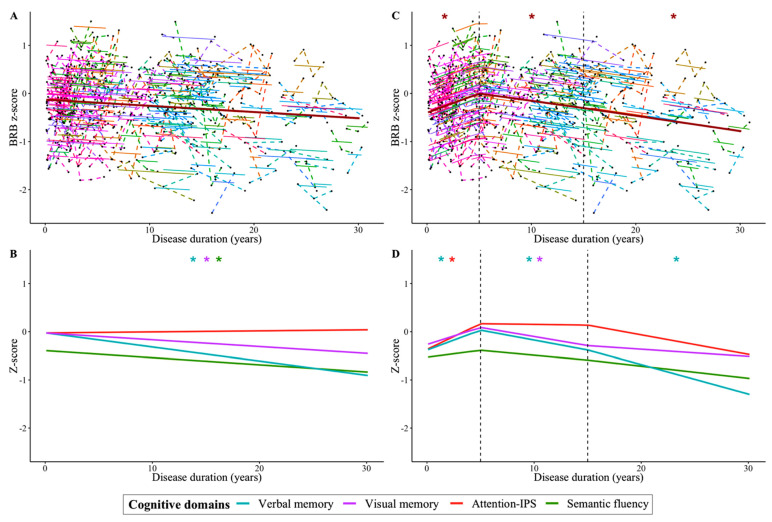
Figure 1.
Dynamics of cognitive performance in MS as the disease progresses. The global cognition z-score (A) and cognitive domains z-score (B) were modeled by mixed-effect regressions. The duration of the disease was divided into three periods by spline models with two knots (at 5 and 15 years of disease duration) represented by dotted black vertical lines (for the global cognition z-score (C) and each domain z-score (D). Black points joined by a broken line represent the individual trajectories of the changes in the global cognition z-scores, the continuous lines represent the individual fit of the model, and the thicker brown line represents the population model (A,C). Population model lines of cognitive domains are differentiated by color (B,D): blue for verbal memory, purple for visual memory, red for attention-IPS, and green for semantic fluency. The x-axis represents the time in years from clinical onset. All models were fitted using the lme4 package in R version 3.5.2 (R Foundation for Statistical Computing: * p < 0.05).

