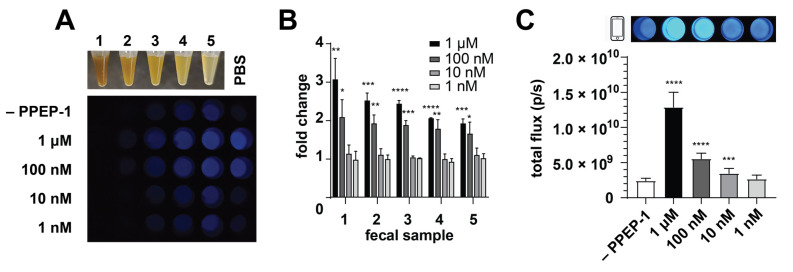
Figure 5.
Biosensor performance in fecal samples. (A) Representative phone camera images of CgNluc (1 µM) incubated with various samples of feces and PPEP-1. Serial dilutions (1:2) were performed using PBS. Samples were diluted to 10 nM CgNluc and imaged. (B) Bioluminescent outputs of CgNluc (1 µM) treated with PPEP-1 (0–1 μM), then added to fecal samples to a final concentration of 10 nM CgNluc and quantified. (C) CgNluc (1 µM) incubated directly in fecal samples with titrating concentrations of PPEP-1. Representative phone camera images at 10 nM CgNluc are shown above. Samples were diluted to 1 nM CgNluc for quantification. **** p < 0.0001; *** p < 0.001; ** p < 0.01; * p < 0.05.

