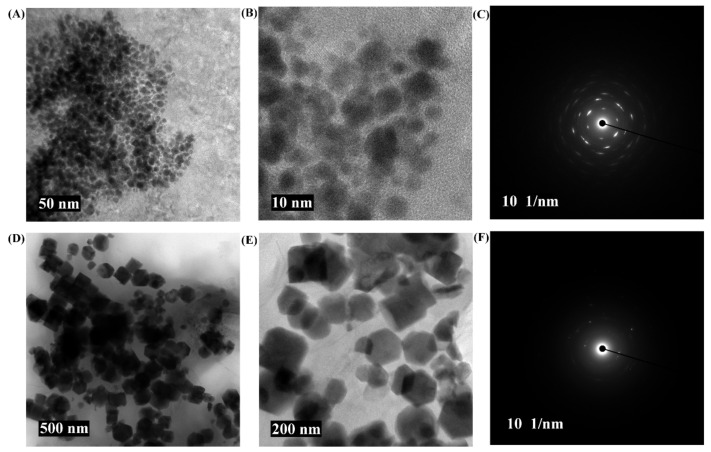
Figure 4.
FE-TEM micrograph of PG-AuNPs and PG-ZnONPs. (A) FE-TEM micrograph of PG-AuNPs at a resolution of 50 nm, (B) FE-TEM micrograph of PG-AuNPs at a resolution of 10 nm, (C) SAED of PG-AuNPs, (D) FE-TEM micrograph of PG-ZnONPs at a resolution of 500 nm, (E) FE-TEM micrograph of PG-ZnONPs at a resolution of 200 nm, and (F) SAED of PG-ZnONPs.

