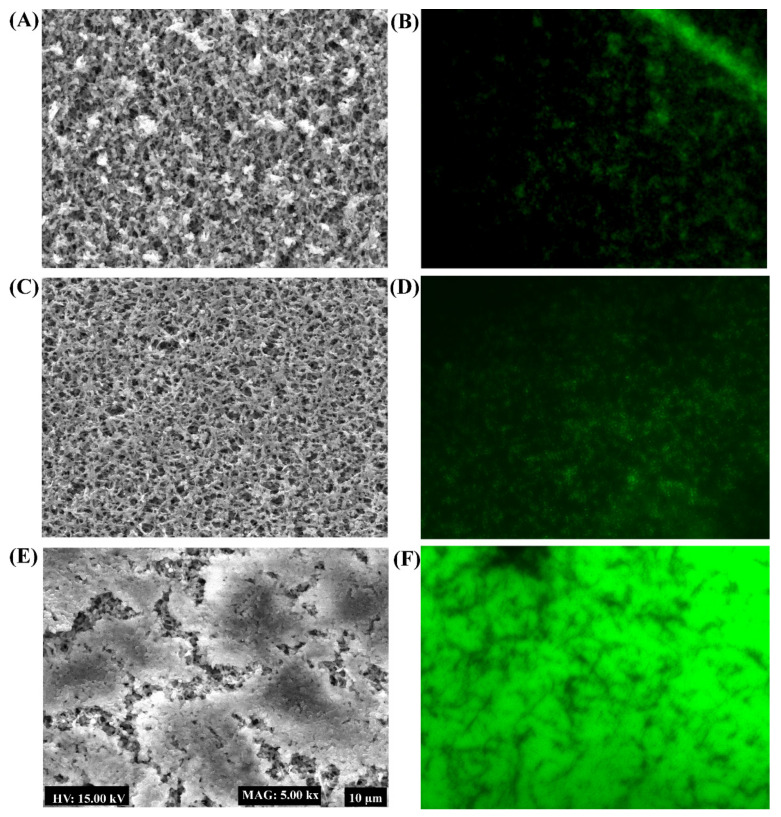
Figure 8.
Biofilm architecture analysis of P. aeruginosa treated with PG-AuNPs and PG-ZnONPs. (A) SEM image of the biofilm cells treated with PG-AuNPs (512 μg/mL), (B) fluorescent image of the biofilm cells treated with PG-AuNPs (512 μg/mL), (C) SEM image of the biofilm cells treated with PG-ZnONPs (512 μg/mL), (D) fluorescent image of the biofilm cells treated with PG-ZnONPs (512 μg/mL), (E) SEM image of the untreated biofilm cells (control), and (F) fluorescent image of the untreated biofilm cells (control).

