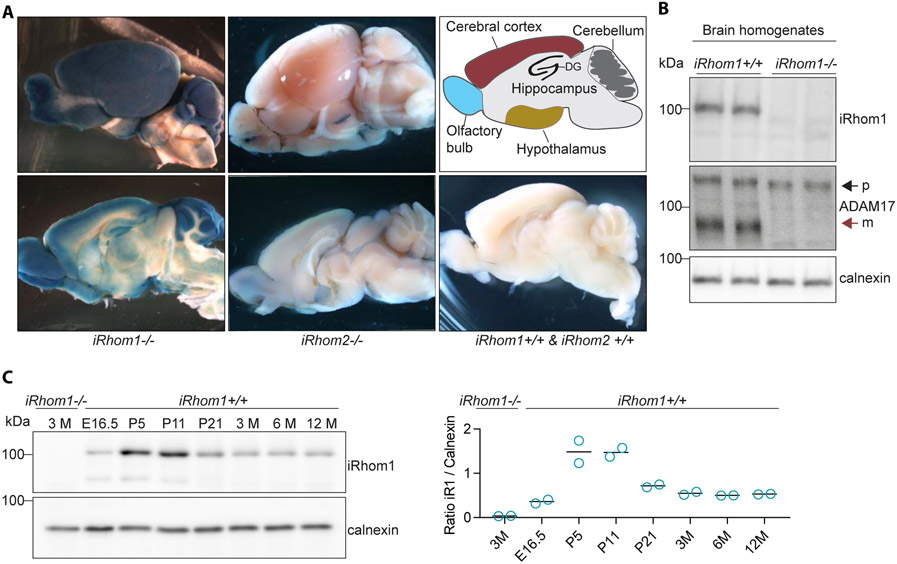
Figure 1: iRhom1 expression in the murine brain.
A) X-Gal staining of brain slices of adult iRhom1−/−, iRhom2−/− and control (iRhom1+/+, iRhom2+/+) mice (N=3). B) Comparison of ADAM17 maturation by Western blot analysis of brain homogenates of iRhom1−/− mice and iRhom1+/+ littermate controls at the age of 3 months (N=4). The black arrow indicates the immature (p, proform/inactive) and the red arrow the mature (m, active) form of ADAM17. C) Western blot analysis of brain homogenates of mice of different ages revealing iRhom1 protein abundance during development (N=2). The quantification of the iRhom1 (iR1) signal relative to calnexin is shown.

