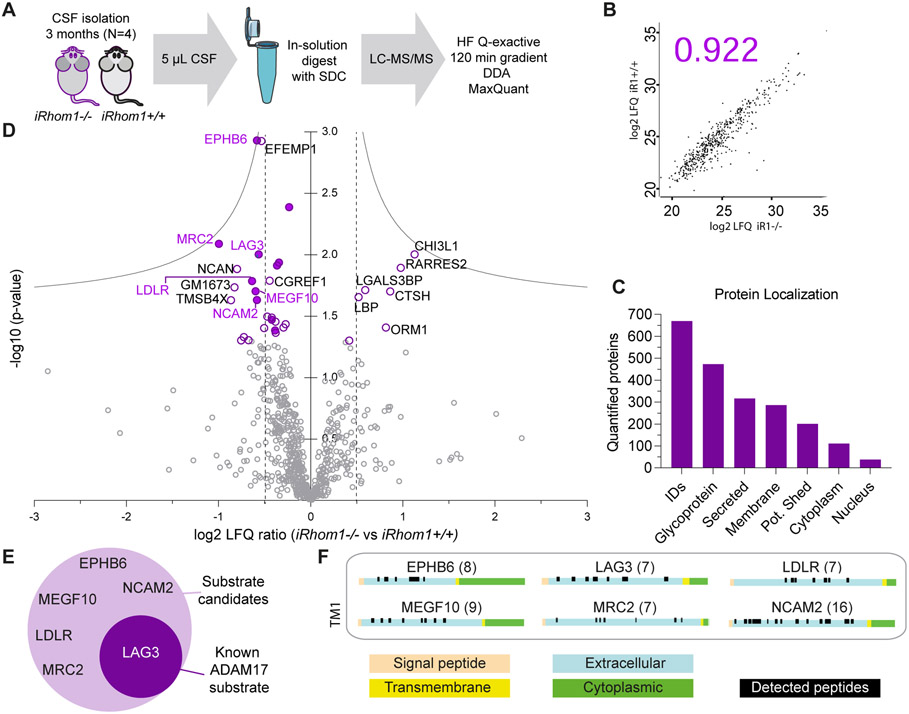
Figure 3: CSF analysis of iRhom1−/− mice.
A) Workflow of the proteomic CSF analysis comparing iRhom1−/− mice to littermate controls (iRhom1+/+) at the age of 3 months (N=4). B) Representative Pearson correlation coefficient of log2 LFQ values of all quantified proteins. Individual coefficients for all experiments are given in Suppl. Table S1. C) Number of proteins quantified in at least one group in 3 of 4 biological replicates and their distribution according to cellular localization on UniProt. Proteins with a single transmembrane domain or a GPI-anchor were grouped as potentially shed proteins. D) Volcano plot depicting for each protein the log2 abundance change in the CSF of iRhom1−/− compared to littermate control mice and the negative log10 p-value (two-sample t-test, N=4). Permutation-based false discovery rate (FDR) estimation is visualized with the grey hyperbolic curves. Proteins with a p-value below 0.05 are highlighted with a purple circle and their protein name. Potentially shed proteins are indicated with a filled circle. E) Potential ADAM17 substrate candidates which show a significant reduction (p-value < 0.05) in iRhom1−/− CSF. LAG3 is a known ADAM17 substrate and is highlighted with white letters. F) The peptide distribution according to the specific protein domains of all ADAM17 substrate candidates was visualized using the web tool Quantitative Analysis of Regulated Intramembrane Proteolysis (QARIP) (85). The number in brackets indicates the number of unique peptides identified for each candidate.

