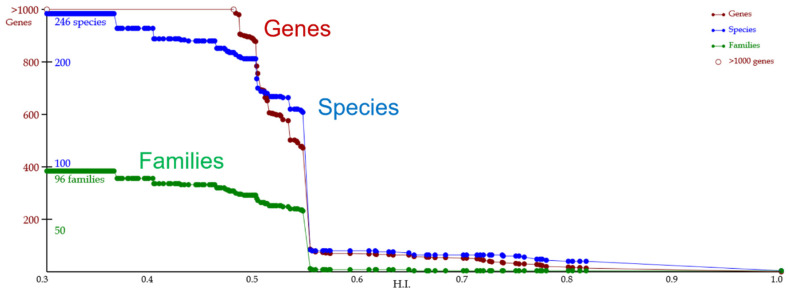
Figure 1.
Line charts for a lineage of gene groups for the S. cerevisiae gene NP_015154.1. This diagram is depicted on the Homology page. The horizontal axis is the HI. Each dot represents a homologous gene group, which is hypothetically equivalent to a gene in an ancient organism. Red, blue, and green lines represent the numbers of genes (sequences), species, and families contained in individual gene groups, respectively. These numbers represent one of the groups’ descendants in extant organisms. Tracking groups of homologous genes is based on the HI. Evolution time goes from the left edge to the right edge.

