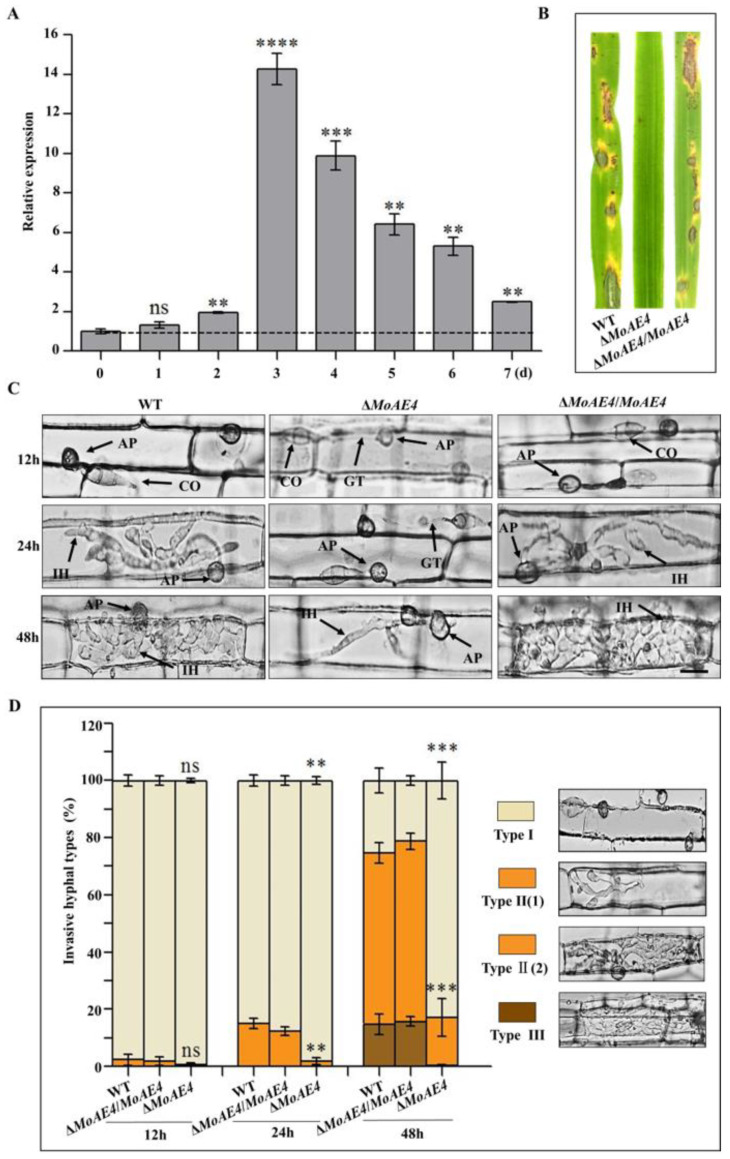
Figure 6.
Pathogenesis analysis of the wild type and created strains. (A) Transcription abundance of MoAE4 during disease development. (B) Spray-inoculation assay. (C) Rice leaf sheath infection assay. Scale bar = 10 μm. IH, infectious hyphae; CO, Conidium; GT, Germination tube; AP, appressorium. (D) The infection rate was calculated according to the number of type I to type III events. The infection status of more than 100 germinated conidia per leaf sheath was scored at 12, 24, and 48 h post inoculation. Type I, conidia with mature appressoria; Type II, primary hyphae formed, infectious hyphae extended and branched in one cell; Type III, infectious hyphae crossing to neighboring cells. Values represent the averages of five measurements ± standard deviation. The statistical analysis was performed using a one-way ANOVA with Tukey’s multiple comparison test. The averages were taken from the quadruplicate analysis. Values are based on three biological samples and error bars indicate SD, ns p > 0.05. ** p < 0.01; *** p < 0.001. **** p < 0.0001.

