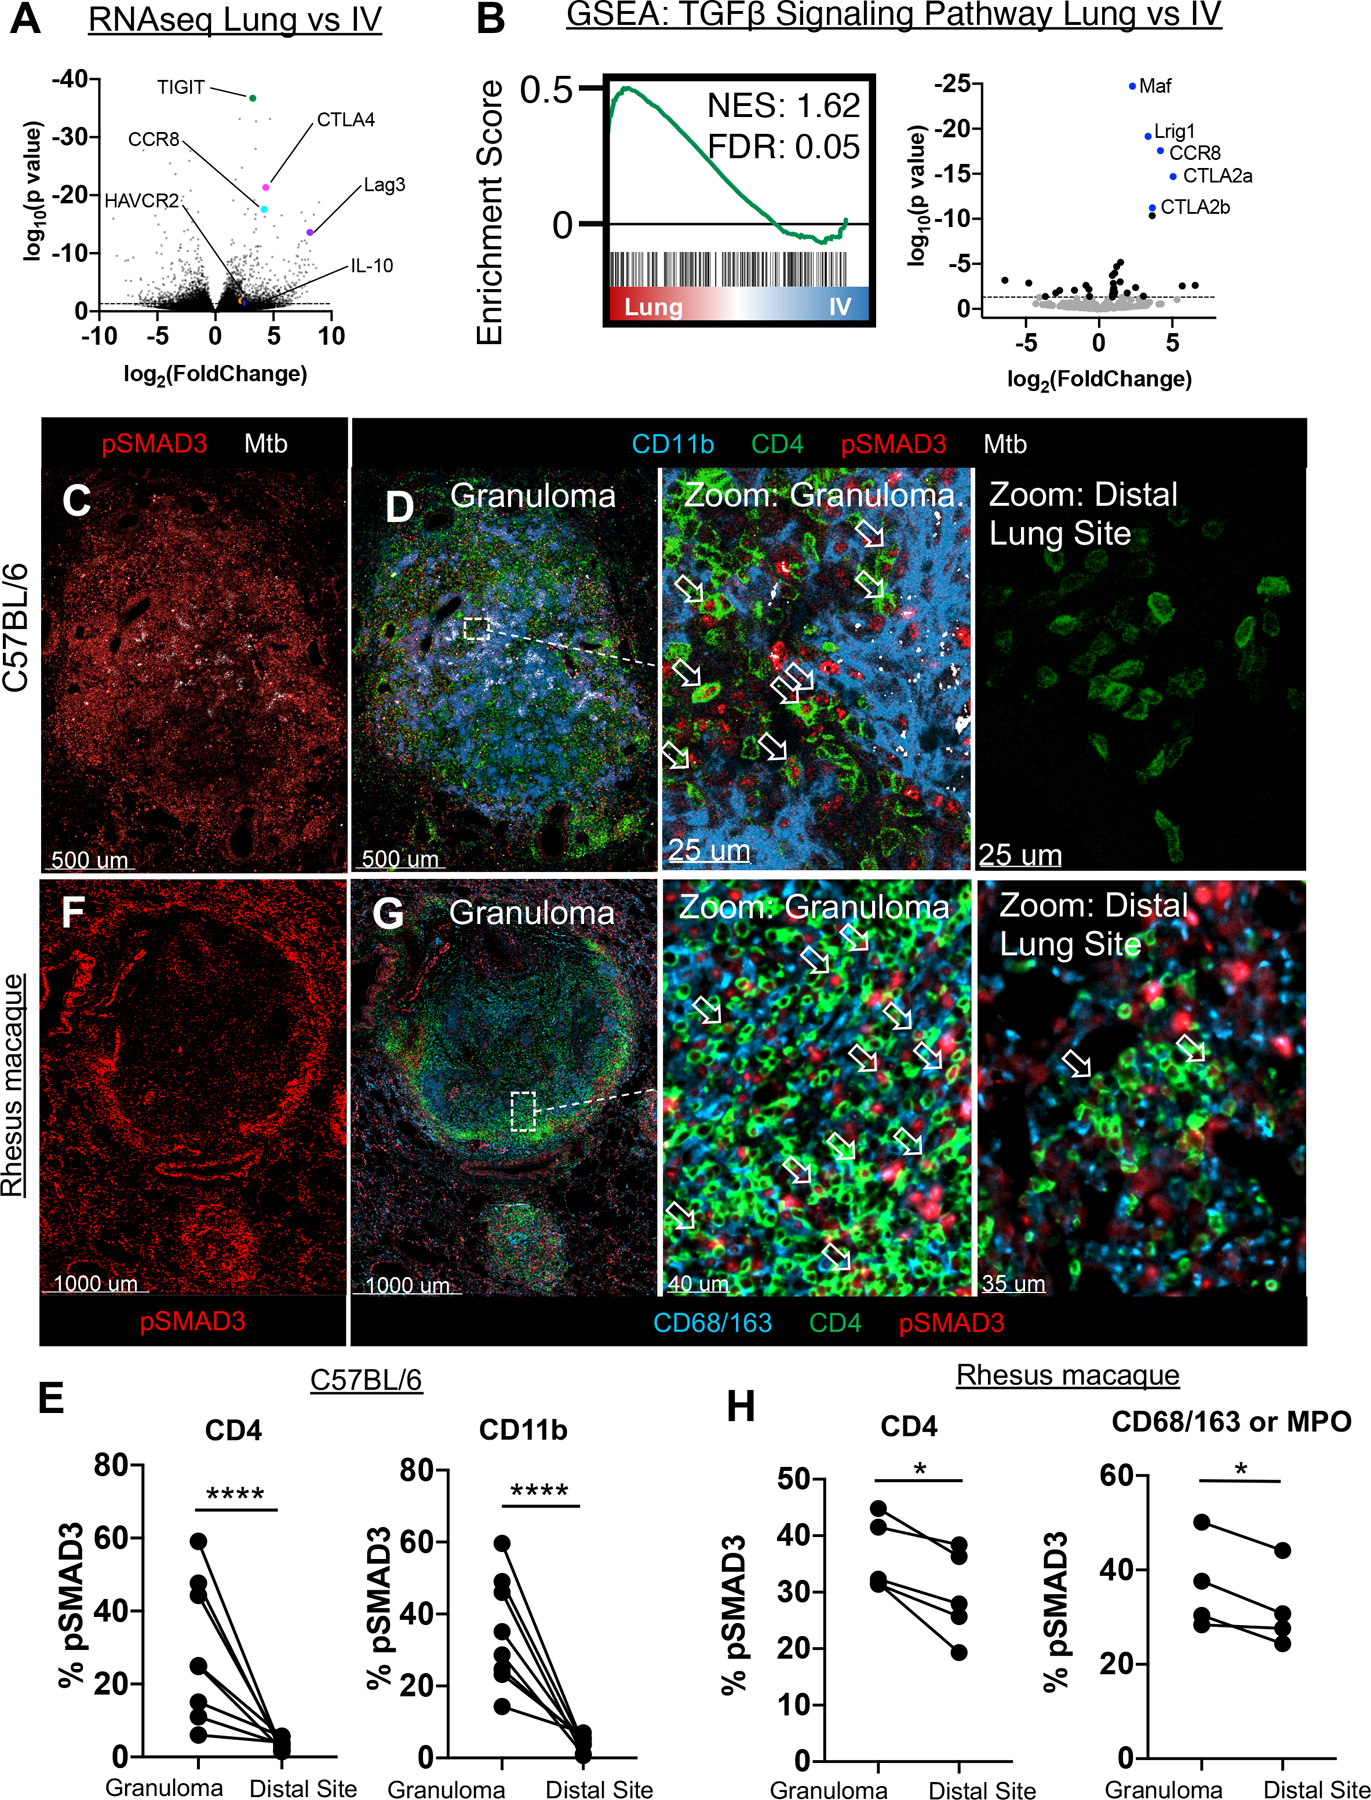
Figure 2: TGFβ signaling by immune cells within the granuloma.

A-B: WT mice infected with 50 CFU Mtb, lungs taken at 28 days p.i. for transcriptome analysis of ESAT-6 specific CD4 T cells in the vasculature vs lung parenchyma. (n=5) A) Volcano plot of differentially expressed genes by Mtb-specific T cells within the parenchyma vs intravascular space. Highlighted genes associated with immunosuppressive signals on T cells. B) GSEA analysis of genes downstream of TGFβ signaling in the parenchyma (Lung), versus vasculature (IV). C-E: Mice infected with ULD Mtb, lungs harvested at d35 p.i. (n=7) C) Representative confocal image of pSMAD3 staining within the granuloma. D) Zoom-in images show pSMAD3 staining within T cells (arrows) and myeloid cells near Mtb-infected cells (left), or at a distal lung site (right). E) Histocytometry quantification of pSMAD3 staining in CD4 T cells and CD11b+ myeloid cells by site. F-H: Rhesus macaques infected with 4–8 CFU, lungs harvested at d62–89 p.i. (n=5) F) Representative confocal image of granuloma, showing pSMAD3 staining. G) Zoom-in images showing pSMAD3 signal in relation to CD4 (arrows) and CD68/163 cells (macrophages). H) Histocytometry quantification of pSMAD3 staining in CD4+ and CD68/163+ cells. Single-group comparisons by paired t test. Points represent individual animals and lines connect different sites (granuloma, distal lung) within the same animal. FDRs (B) were calculated using the Benjamini-Hochberg method and p values were calculated using the Mann-Whitney U test. *p < 0.05, **p < 0.01, ***p < 0.001, ****p < 0.0001. Data are representative of one (A, B, F-H) or two (C, D) independent experiments. See also Figure S3.
