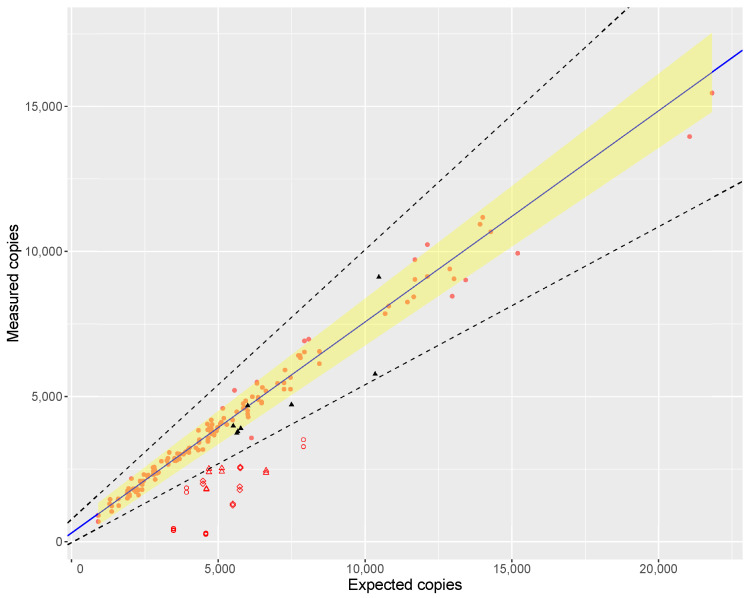
Figure 1.
Correlation between measured and expected target copies. The figure shows the Crocus sativus reference samples (●), their correlation line (blue), and 95% prediction interval (shaded area). The boundaries of the acceptable range (80% and 120% ddPCR purity) are shown as dashed lines. Results for the stigma samples are shown in black (▲) and laboratory prepared admixtures are shown in red (∘ for samples amdmixed with safflower, ⋄ for samples admixed with wheat flour, for samples admixed with Capsicum annuum).

