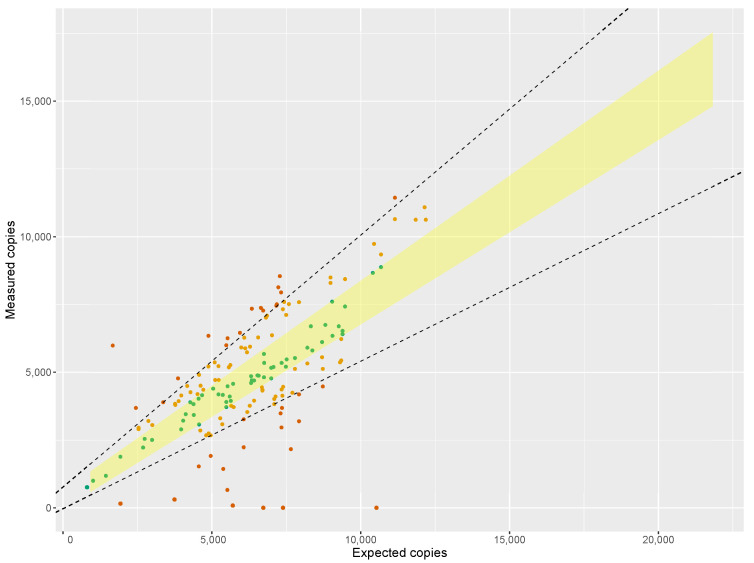
Figure 2.
Overview of the market sample results: measured copies per sample plotted in function of their ’expected copies’, the shaded area represents the 95% prediction area based on the regression of the reference samples. The boundaries of the acceptable range (80% and 120% ddPCR purity) are shown as dashed lines. Samples have been colored depending on their categorization: green for 100% ddPCR purity, orange for 80–120% ddPCR purity, red for <80% or >120%.

