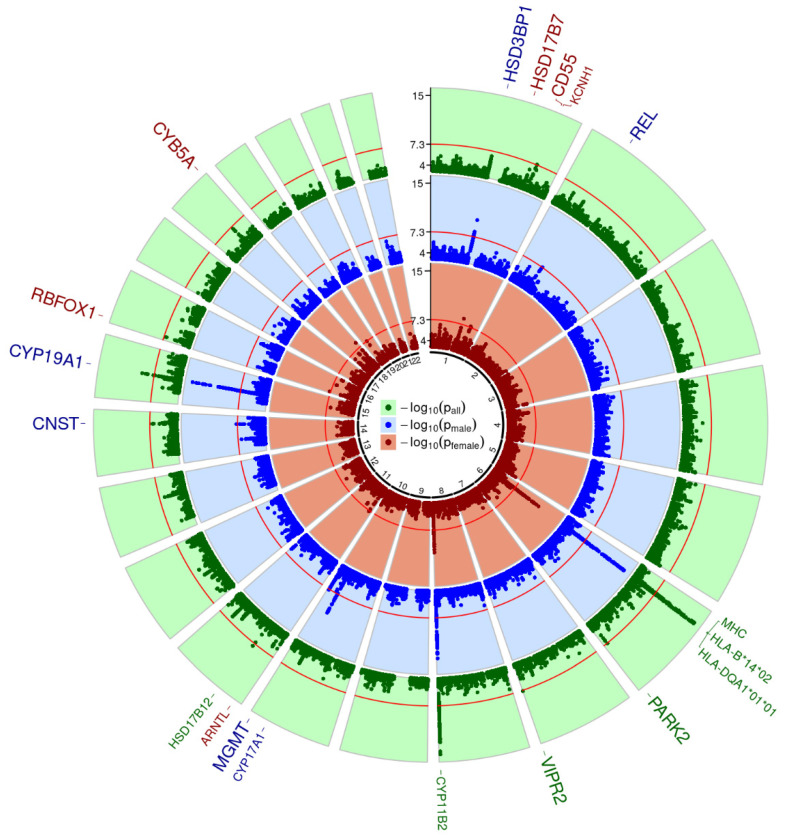
Figure 2.
Circular Manhattan plot of GWAMA results. Minimal p-values across analyzed traits are presented for each analysis group (green—all samples; blue—male only; red—female only). In each Manhattan circle, the genome-wide significance threshold of 5 × 10⁻⁸ is given a red circle (−log10 transformed). Loci with genome-wide significant SNPs are named outside the circles. They are colored according to the analysis setting showing the highest significance for that locus. Increased font size indicates novelty, while replicated loci are displayed in smaller font size.

