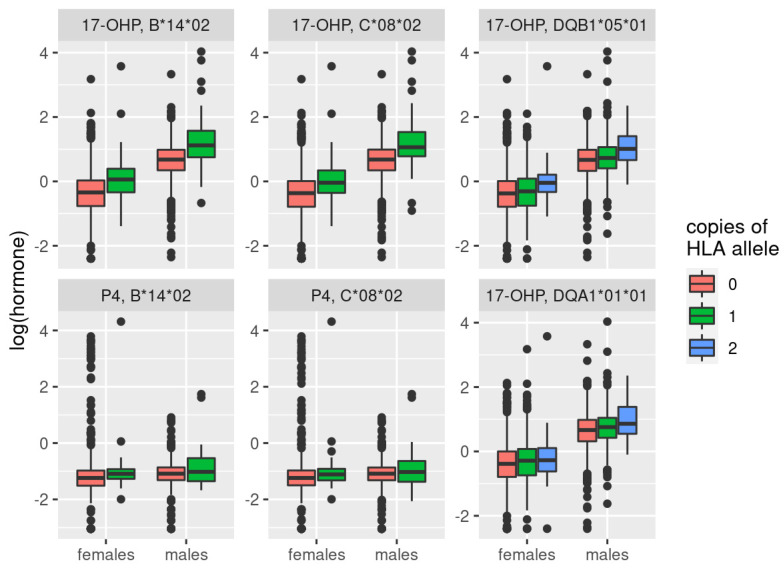
Figure 4.
Boxplot of hormone levels for significant associations of HLA subtypes with either 17-OHP or P4. There was only a single male and female sample that had two copies of C*08*02 and B*14*02. For this plot, they were assigned to the group carrying one copy. Data of LIFE-Adult and LIFE-Heart were pooled for this plot, while analyses were performed with a fixed-effect meta-model.

