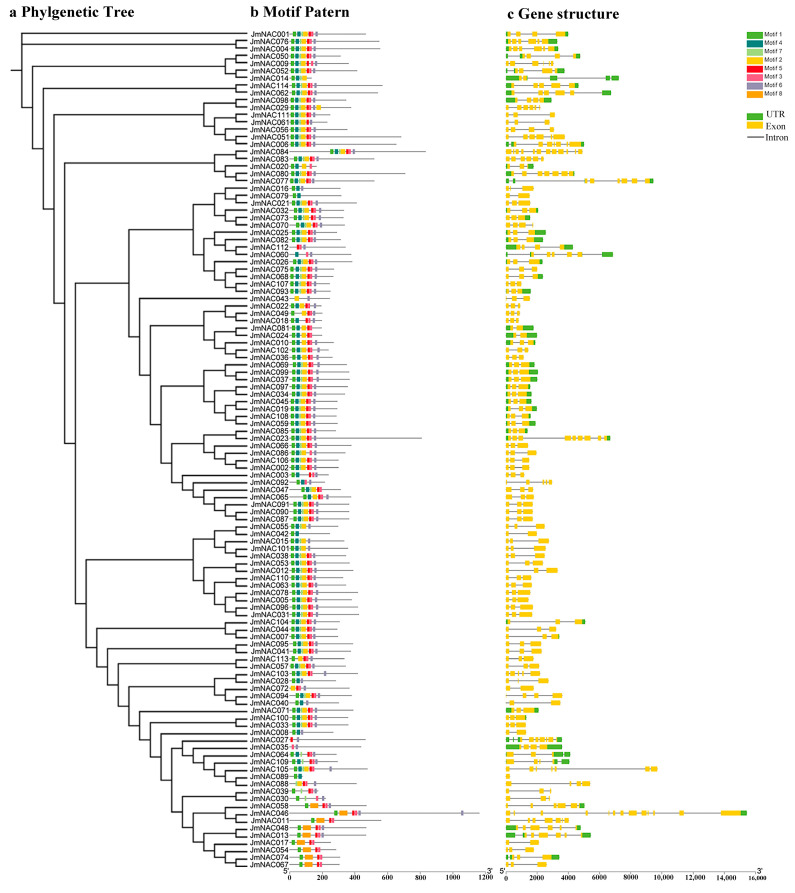
Figure 3.
Phylogenetic relationships, gene structure and protein motifs in JmNAC genes. (a) The phylogenetic tree of all NAC proteins in J. mandshurica was constructed using the neighbour-joining method with 1000 replicates in the MEGA 7.0 software (Mega Limited, Auckland, New Zealand). (b) The motif composition of J. mandshurica NAC proteins. Motifs 1–10 are displayed in different coloured boxes. (c) CDS–UTR structure of JmNAC genes. Yellow boxes represent CDS; black lines indicate introns; green boxes represent the untranslated 5′ and 3′ regions.

