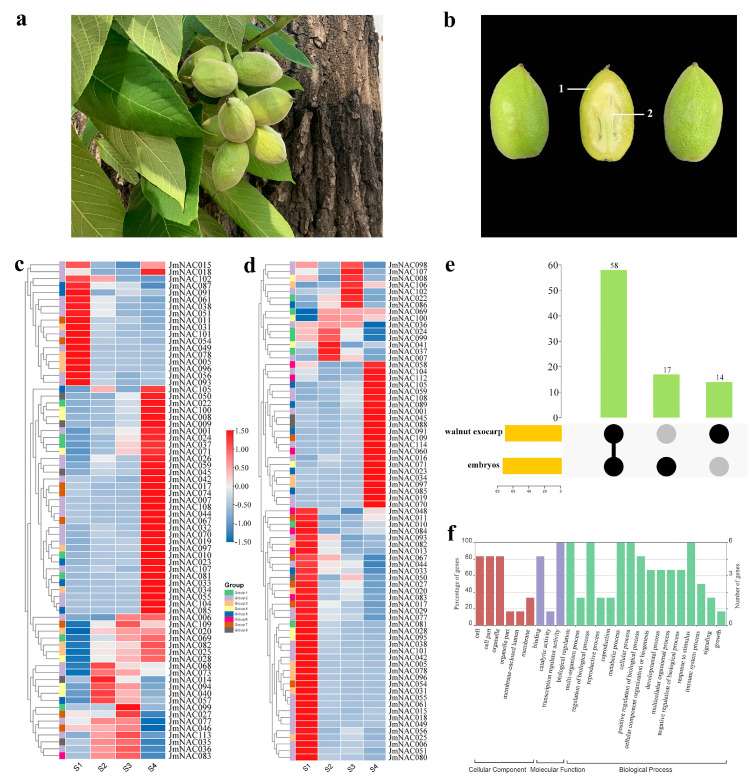
Figure 6.
Expression profiles and functional analysis of JmNAC genes in different stages of fruit development and ripening. (a) Photographs of J. mandshurica fruits. (b) The tissue structure of J. mandshurica fruit. “1” indicates the walnut exocarp. “2” indicates the walnut embryos. (c) Heatmap representing 75 JmNAC gens in walnut exocarp at 30 days (S1), 50 days (S2), 70 days (S3) and 90 days (S4) after natural pollination. (d) Heatmap representing 75 JmNAC gens in walnut embryos at 30 days (S1), 50 days (S2), 70 days (S3) and 90 days (S4) after natural pollination. Group I–VIII correspond to the subgroups in the phylogenetic tree in Figure 2. (e) Upset plot of JmNAC genes expressed in walnut exocarp and embryos. (f) GO annotation analyses of the common JmNAC genes expressed in walnut exocarp and embryos.

