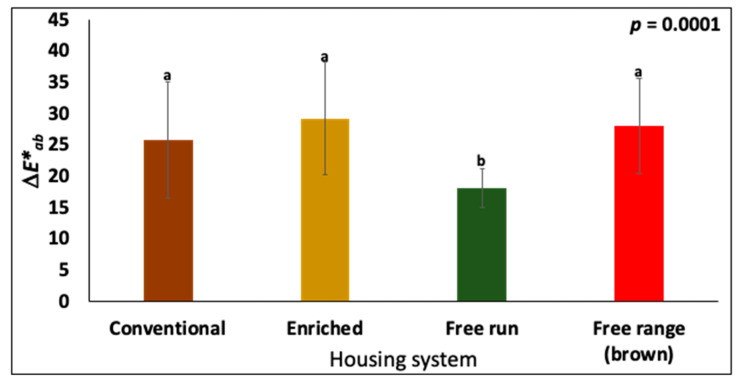
Figure 3.
ΔE*ab values of eggs from hens in different housing systems. The data shown corresponds to eggs from mid-lay hens. The values represent the mean ± standard deviation from each condition (n = 30). The values with different superscript letters (Tukey multiple means comparison) are significantly different (ANOVA; p < 0.05).

