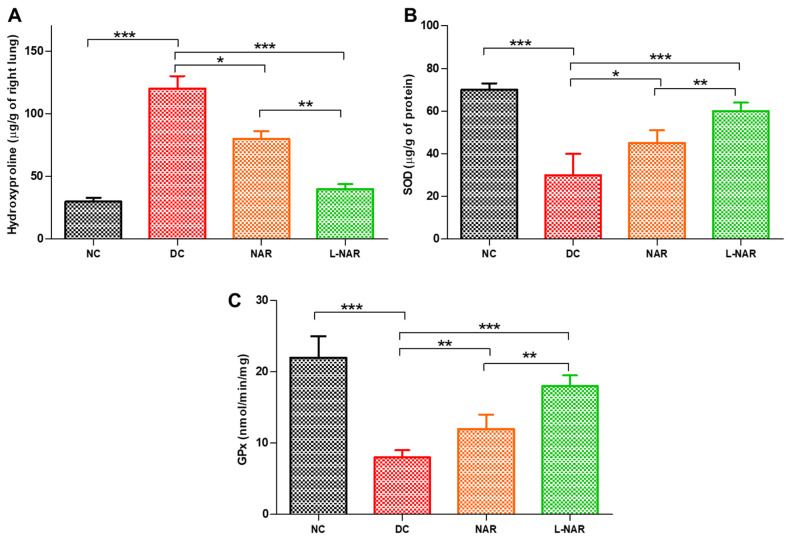
Figure 6.
Hydroxyproline (A), Superoxide dismutase (SOD, (B)), and Glutathione peroxidase (GPx, (C)) activity from various groups only normal control (NC), disease control (DC), inhalation therapy of pristine naringin (NAR), and liposomal naringin (L-NAR) (n = 12). *, ** and *** indicate significant difference by Newman–Keuls analysis after ANOVA at 95 percent confidence level at p < 0.05, p < 0.01 and p < 0.001 respectively.

