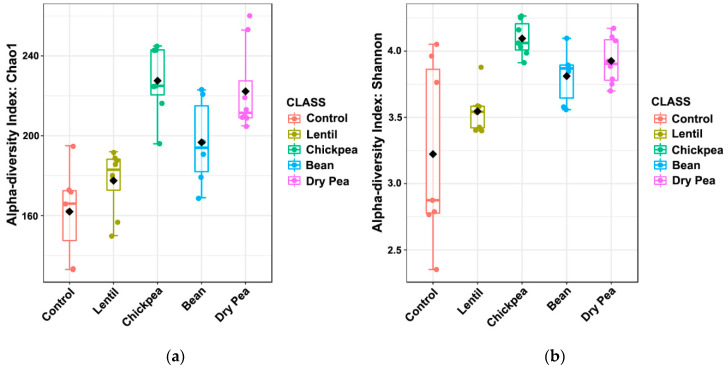
Figure 3.
The boxplots of α-diversity metrics of the cecal microbiota across diet groups at the ASVs level: (a) α-diversity measured with the Chao1 index indicating differences in richness; Kruskal-Wallis test statistic = 24.501, p-value = 6.338 × 10⁻⁵; (b) α-diversity measured with the Shannon index accounting for differences in richness and evenness; Kruskal-Wallis test statistic = 18.41, p-value = 1.026 × 10⁻³.

