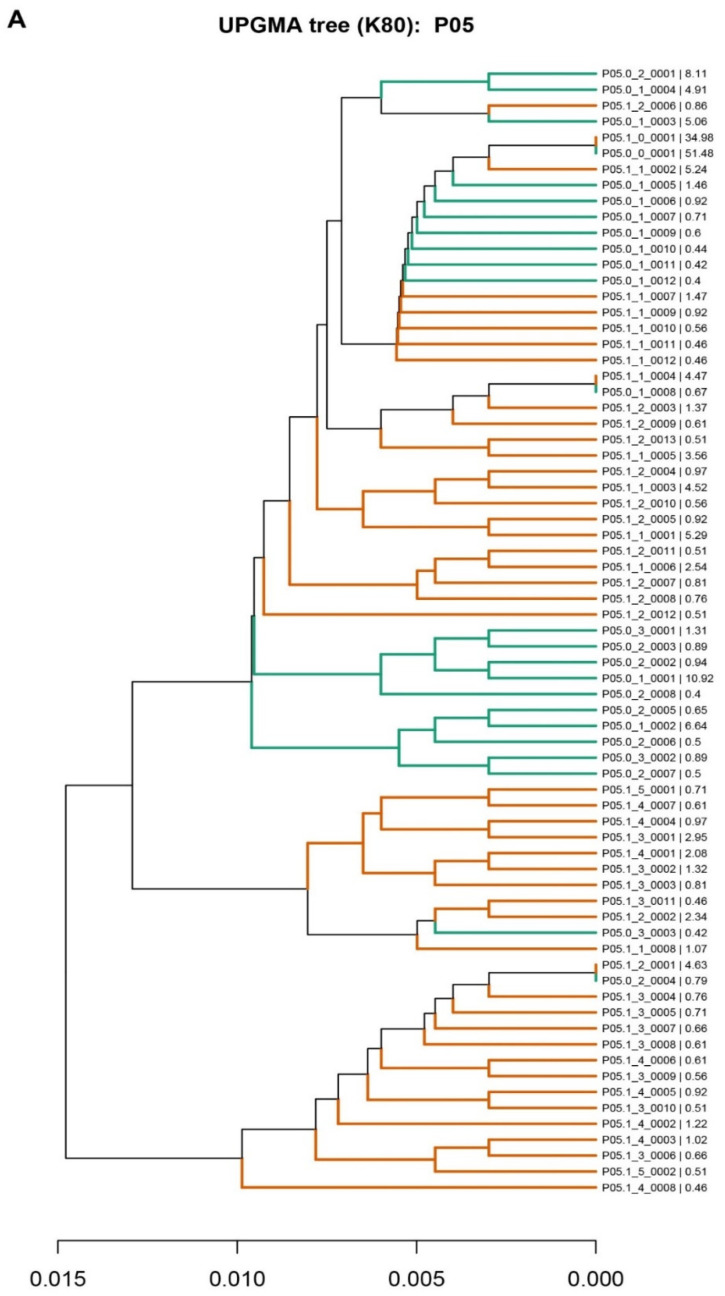
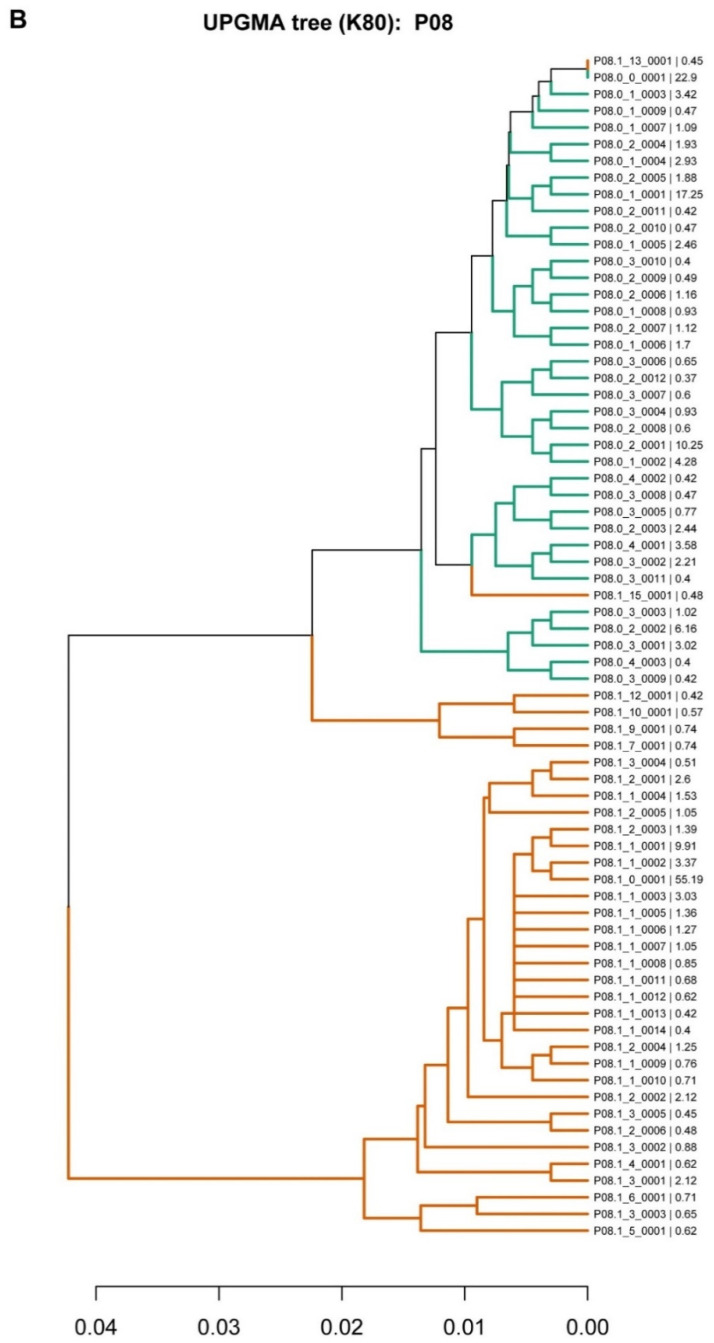
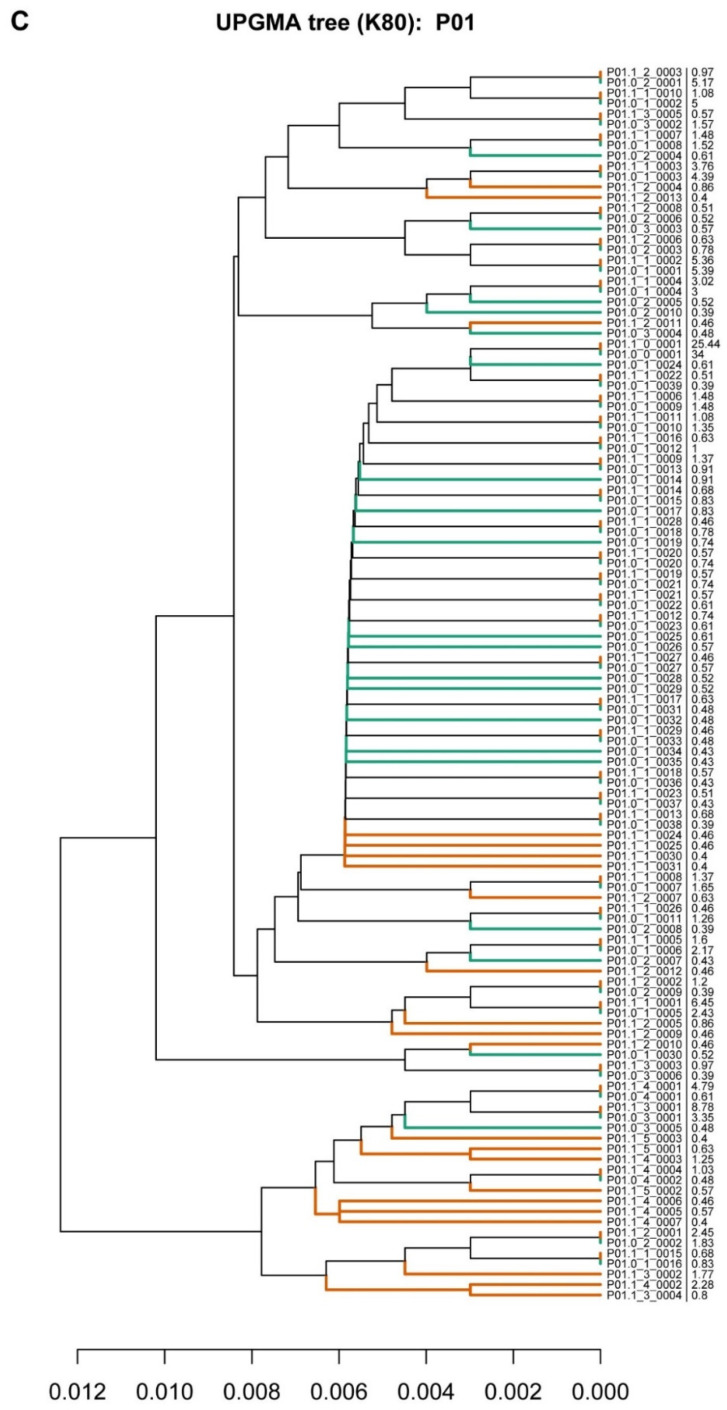
Figure 1.
Phylogenetic trees representing the liver quasispecies population before (pre-LT) and after (post-LT) liver transplantation. Haplotypes from the pre-LT quasispecies are represented in green, and haplotypes from the post-LT quasispecies are in orange, as examples of the three infection patterns found. (A) Patient 05; (B) Patient 08; (C) Patient 01. The nomenclature used was Pxx.y_z_vvvv, where xx is the patient identifier (P01, P02 etc), y is the sample identifier (0 for pre-LT, 1 for post-LT), z is the number of differences between the haplotype and the master sequence, and vvvv is an identifier for haplotypes with the same number of mutations in the quasispecies. The last percent number represents the frequency at which each haplotype is represented in the quasispecies.


