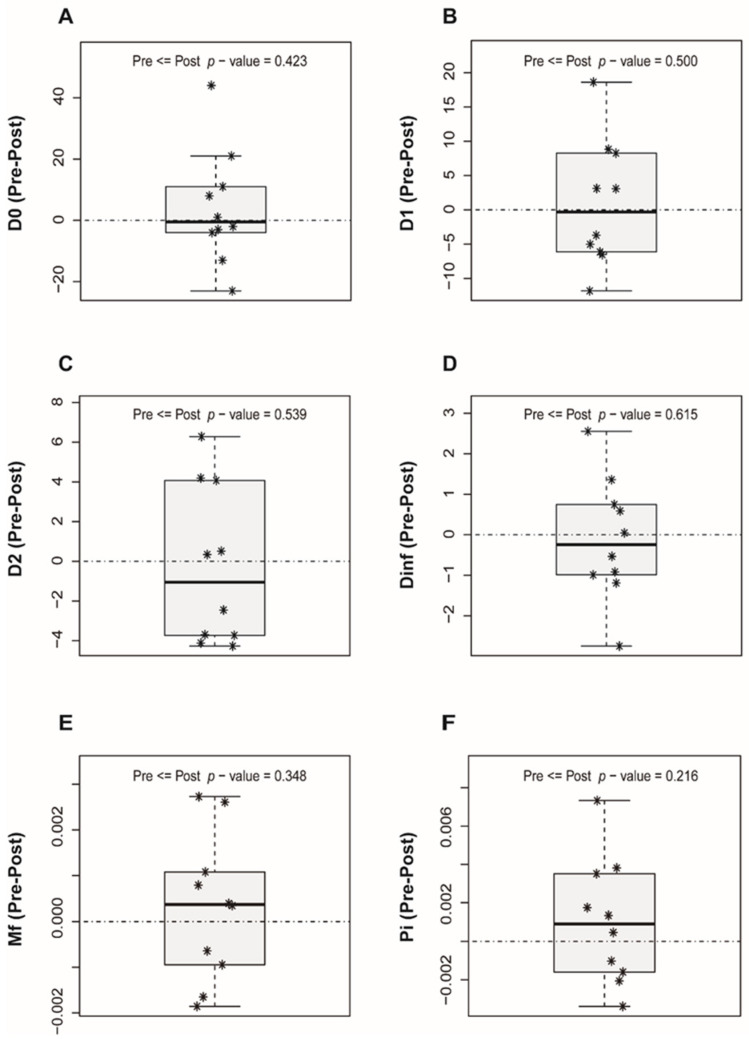
Figure 2.
Boxplots with diversity indices showing differences between the pre-LT and post-LT quasispecies. (A) D0: hill number of order 0, (B) D1: hill number of order 1, (C) D2: hill number of order 2, (D) Dinf: hill number of order infinity, (E) Mfmax: mutation frequency, (F) π: nucleotide diversity. Each patient is represented as *. The p-value resulting from the Mann-Whitney U-test is included.

