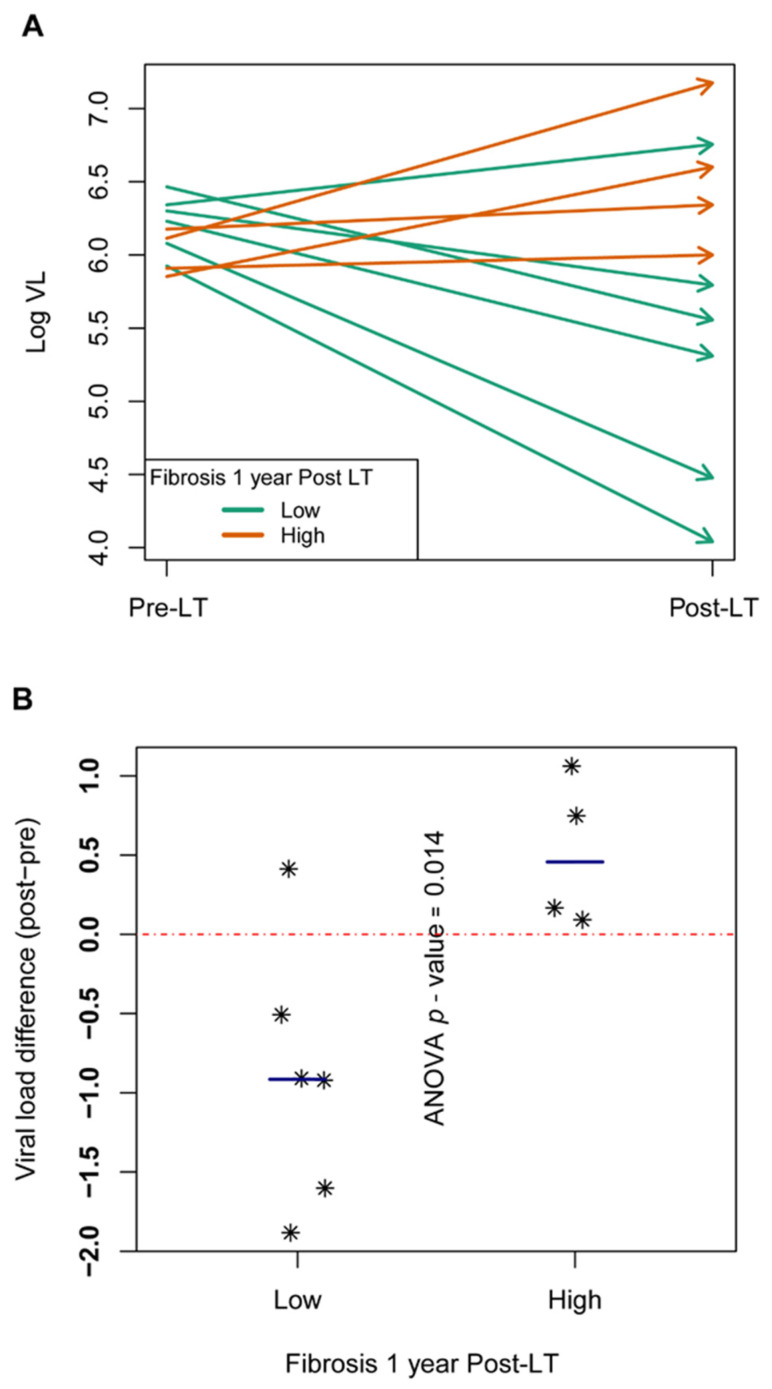
Figure 4.
Viral load differences between pre and post-LT samples. (A) Arrows showing the evolution of log VL from pre-LT (arrow tails on the left) to 15-day post-LT (arrow heads on the right side of the box). At one year post-LT, patients with high fibrosis (F3–F4) in orange, patients with low fibrosis (F0–F2) in green. (B) Scatterplot with differences in log VL at 15 days post-LT minus pre-LT. The ANOVA p-value in the comparison of the two levels of liver damage is included. Each patient is represented as *.

