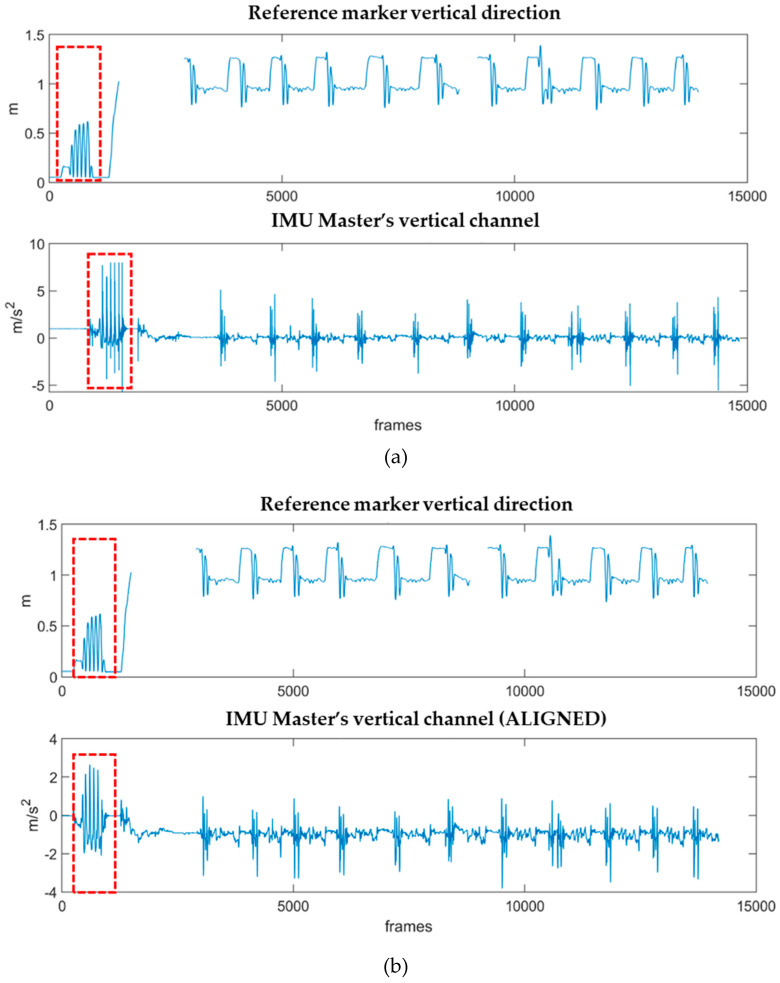
Figure 5.
(a) Vertical position of the reference marker along the y-axis of the laboratory (vertical, positive upwards) and acceleration data along the z-axis of the master sensor, attached to the reference marker (vertical, positive downwards). The spikes used as synchronization trigger are visible at the very beginning of each signal (red square); (b) Aligned signals of reference marker and acceleration of the master by using the delay information coming from the cross-correlation calculation.

