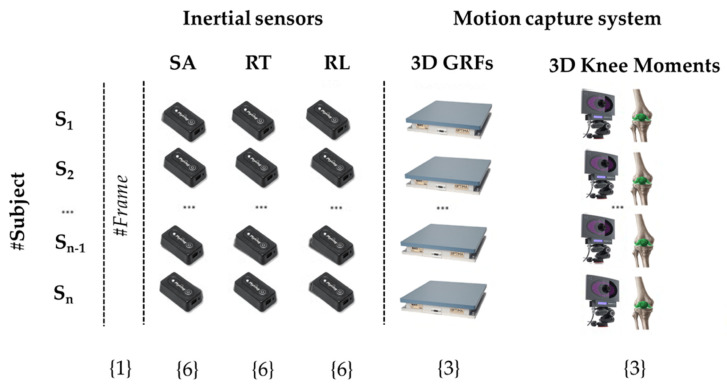
Figure 7.
Visual structure of the dataset. The first column contains the reference index of the frame of each jump, columns 2–19 contain the data recorded by the three IMUs, placed on the sacrum (SA), right leg (RL), and right thigh (RT), whilst columns 20–25 contain the 3D right GRFs and the right knee moments. Numbers in parentheses indicate how many features (columns) belong to each source.

