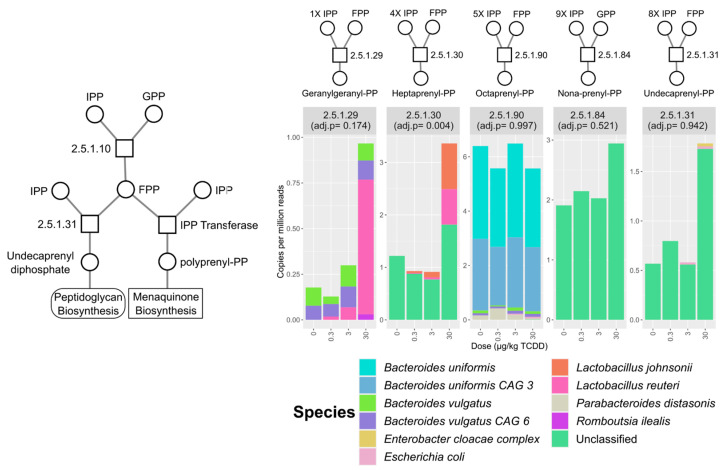
Figure 5.
Relative abundance of polyprenol transferase EC annotations identified in the mouse cecum metagenomic dataset. Stacked bar plots represent mean relative abundance of grouped EC numbers (n = 3) and represent identified species that contributed to mean total abundance for each treatment group. The number of isopentenyl diphosphate (IPP) and farnesyl diphosphate (FPP) molecules used for respective polyprenol biosynthesis are also denoted. Adjusted p-values were determined by the Maaslin2 R package. Abbreviations: isopentenyl diphosphate (IPP), geranyl diphosphate (GPP), polyprenyl diphosphate (polyprenyl-PP).

