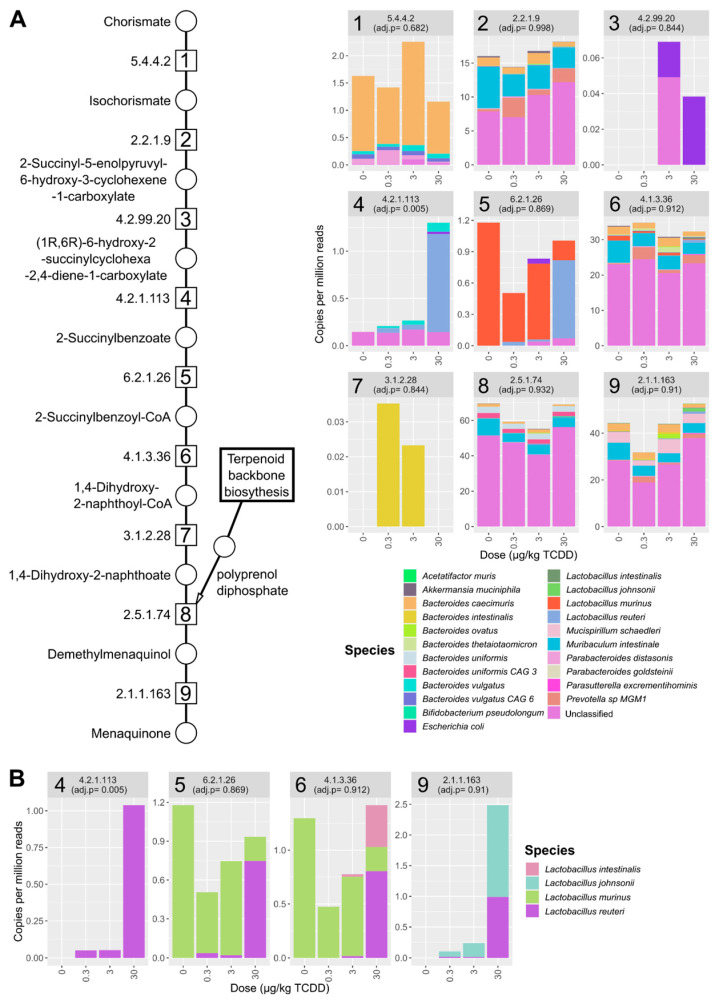
Figure 7.
TCDD-elicited effects on menaquinone biosynthesis. (A) Relative abundance of menaquinone biosynthesis EC annotations identified in the metagenomic dataset. Individual stacked bar plots are labeled with the EC number matching the enzymatic step in pathway schematic. Stacked bar plots of annotated EC numbers involved in menaquinone biosynthesis. Values are mean relative abundance (n = 3) classified to the respective species and in cecum samples from male C57BL/6 mice following oral gavage with sesame oil vehicle or 0.3, 3, or 30 µg/kg TCDD every 4 days for 28 days. (B) Menaquinone biosynthesis EC numbers classified to Lactobacillus species in the cecum metagenomic datasets. Adjusted p-values (adj. p) were determined by Maaslin2 R package.

