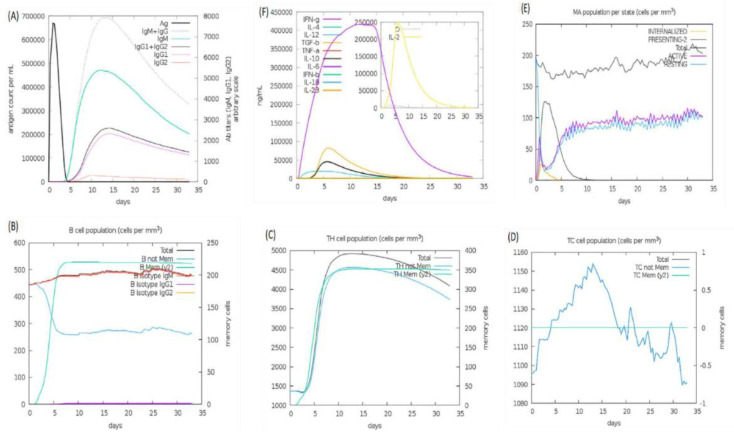
Figure 10.
Immune simulations: panel (A) shows the number of immunoglobulin reactions per milliliter of antigen, panel (B) shows the count of B lymphocytes, panel (C) shows the count of CD4 T-cells, panel (D) shows the count of CD8 T-cells, panel (E) shows the macrophages and the amount of internalized pathogens, and panel (F) shows the secretion concentrations of cytokines and interleukins.

