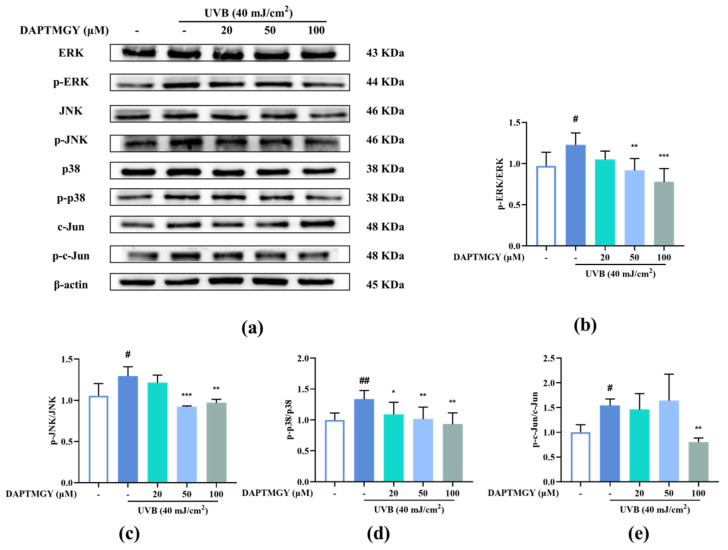
Figure 4.
DAPTMGY blocked phosphorylation of ERK, p-38 and c-Jun in UVB-stimulated HaCaT cells. (a) Western blotting bands of MAPK pathway and AP-1. (b) The ratios of p-ERK/ERK, (c) The ratios of p-JNK/JNK, (d) The ratios of p-p38/p38 and (e) The ratios of p-c-Jun/c-Jun are calculated respectively. Data are shown as mean ± S.D (n = 3). (# and ##) p < 0.05 and p < 0.01, as compared to the blank group (untreated cells). * p < 0.05, ** p < 0.01 and *** p < 0.001, respectively, as compared to the control group. β-actin functioned as the internal control.

