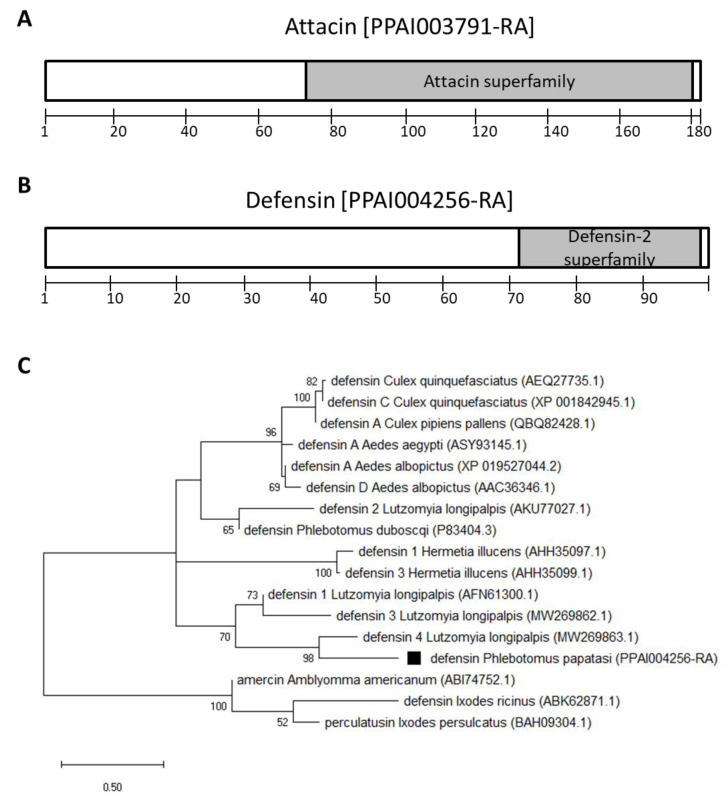
Figure 2.
P. papatasi AMP amino acid sequences. (A,B)- Signature domains identified on the amino acid sequences: grey boxes indicate AMP superfamily domains; numeric scales indicate amino acid positions. (C)- Phylogram of defensin amino acid sequences from P. papatasi and other arthropods inferred by the Maximum Likelihood method, with the WAG model and Gamma distribution. Tick AMPs sequences were used as an outgroup. Numbers on branch nodes indicate bootstrap values higher than 50 %. The Phlebotomus papatasi defensin sequence is indicated by a black square; species names are followed by corresponding Vector Base (P. papatasi) or GenBank (other species) accession numbers; the scale bar indicates the number of substitutions per site.

