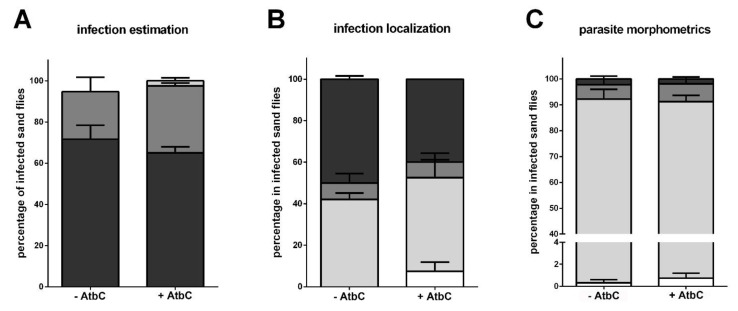
Figure 4.
Leishmania infection intensity, localization, and development on the sixth day. (A) Infection intensity estimation. The y-axis represents the percentage of all individually inspected insects (a total of 40 sand flies in each group). Bar colors indicate infection intensity: light (light grey), moderate (mid grey), heavy (dark grey). (B) Infection progression in the sand fly gut. The y-axis represents the percentage of infected insects. Bar colors indicate sand fly gut localization: abdominal gut (white); thoracic gut (light grey); cardia (mid grey); stomodeal valve (dark grey). (C) Parasite development in the sand fly gut. The y-axis represents the percentage of analyzed parasites. Bar colors indicate parasite developmental forms: procyclic promastigote (white); elongated nectomonad (light grey); leptomonad (mid grey); metacyclic promastigote (dark grey). The x-axis represents AtbC-treated (+AtbC) and non-treated (-AtbC) groups. Vertical bars represent the average values of two independent experiments, and error bars represent the standard error. No significant differences were found (two-way ANOVA).

