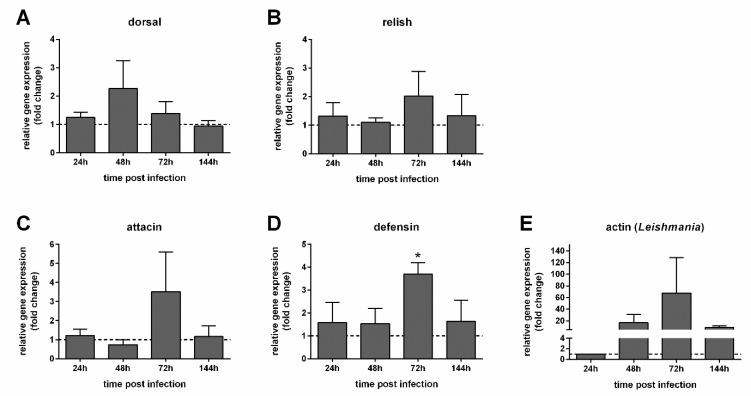
Figure 6.
Relative gene expression of immunity genes in Leishmania-infected females with recovered gut bacteria (EG2). (A) Dorsal; (B) relish; (C) attacin; (D) defensin; (E) Leishmania actin. The y-axis represents the relative gene expression as the fold change values of Leishmania-infected females with recovered gut microbiota (EG2) in comparison to the non-infected control group also treated with AtbC (dotted line) collected at the corresponding time points (A–D); Leishmania detection was expressed in comparison to 24 h (E). The x-axis represents females collected at different time points post infection. Vertical bars represent the average values of three independent experiments, and error bars represent the standard error. A two-way ANOVA was performed to determine significant differences (* p < 0.05).

