Figure 1.
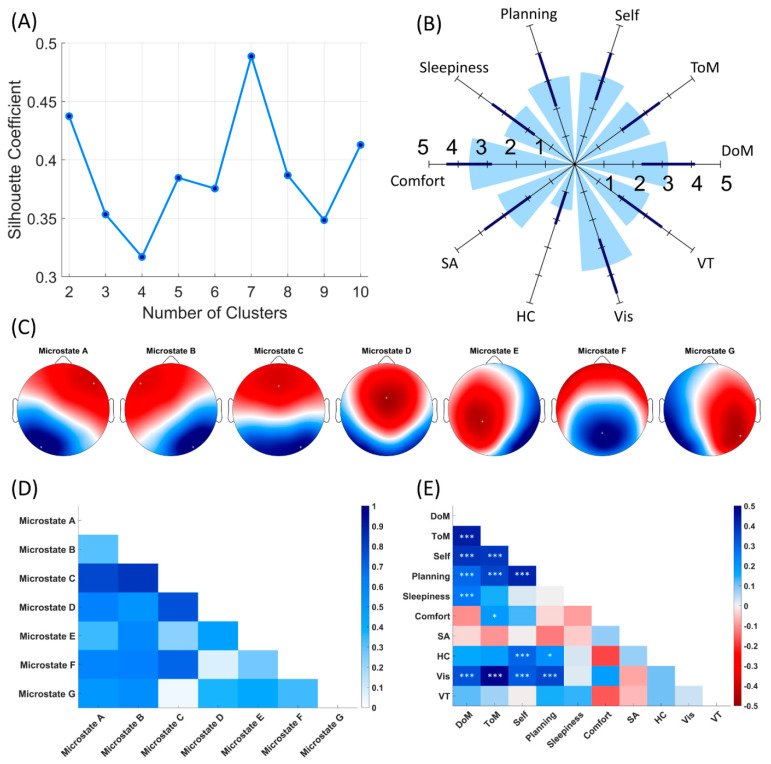
(A) Optimal number of microstates based on the Silhouette Coefficient values for each number of k; number of estimated clusters equals 7. (B) Mean scores of each ARSQ dimension. Dark blue lines indicate standard deviation. (C) Seven microstate group-level topographies. (D) Spatial correlation coefficients between group-level topographies. (E) Intraclass Bayesian Pearson correlation coefficients between ARSQ dimensions. * 10 > BF10 > 3, *** BF10 > 100.

