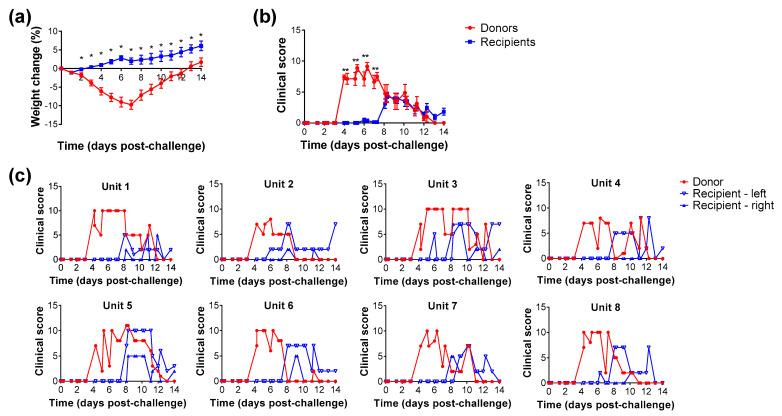
Figure 3.
Clinical observations in donor hamsters challenged with SARS-CoV-2 and recipient animals housed adjacently. (a) Weight change shown as percentage compared to the day of challenge. (b) Average clinical scores for donor and recipient groups. Lines indicate mean value with error bars denoting standard error (n = 8 donor animals and n = 16 recipient animals); *, p < 0.05 (Mann-Whitney test). (c) Clinical scores from each of the 8 set-ups used, each containing one donor animal and a recipient hamster on either side. Lines show results from each individual animal.

