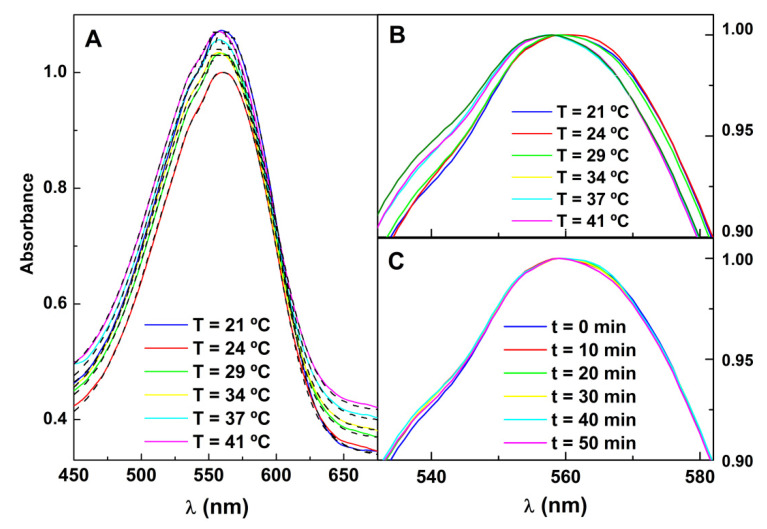
Figure 10.
(A) Variation of absorption spectra of Nile Red in magnetoliposomes containing core/shell nanoparticles, at different temperatures and fitting to the model (dashed curves). (B) Expansion of the normalized spectra of Figure A in the maxima region. (C) Expansion of the normalized spectra in the maxima region at several times of irradiation.

