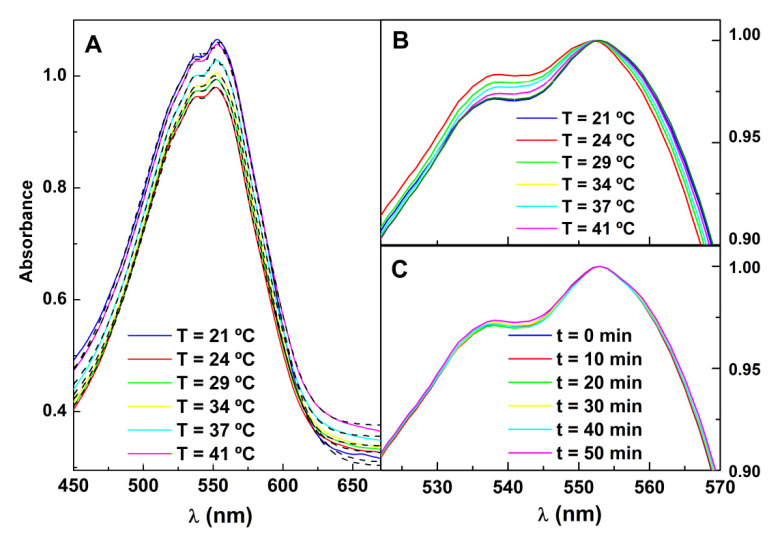
Figure 11.
(A) Variation of absorption spectra of Nile Red in magnetoliposomes containing decorated nanoparticles, at different temperatures and fitting to the model (dashed curves). (B) Expansion of the normalized spectra of Figure A in the maxima region. (C) Expansion of the normalized spectra in the maxima region at several times of irradiation.

