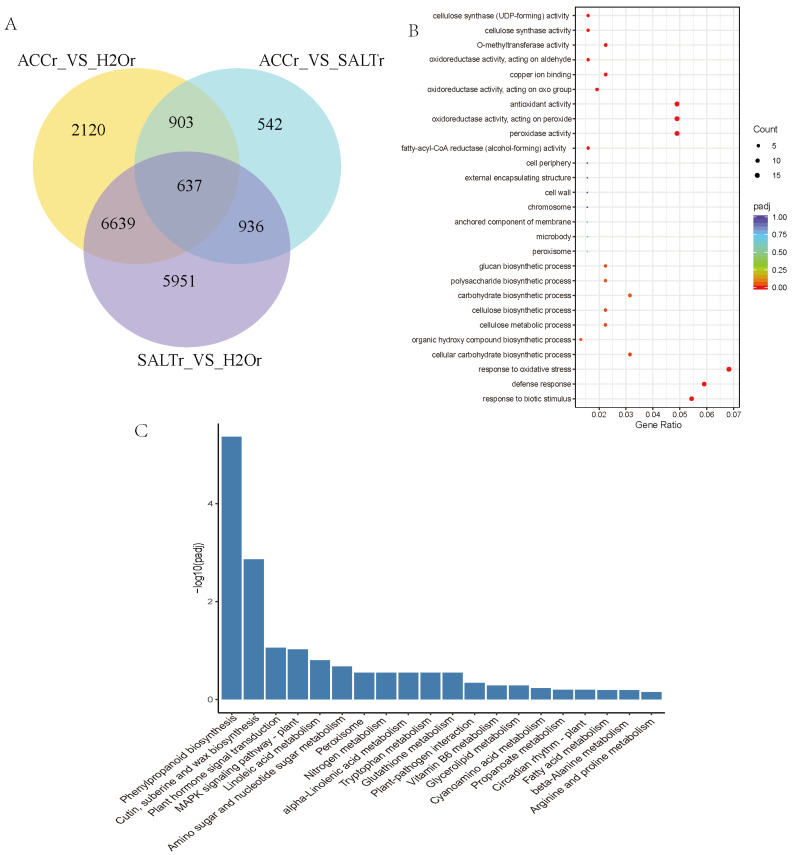
Figure 1.
Multiple comparison of H2Or-vs-SALTr, H2Or-vs-ACCr, and SALTr-vs-ACCr. (A) Venn diagrams of DEGs in multiple comparisons. (B) GO enriched scatter plot of DEGs in ethylene and salt responses of quinoa. Rich factor refers to the ratio of the gene number enriched in the pathway to the number of annotated genes. The bigger the Rich factor, the more significant the enrichment is. The padj value is the corrected p-value after multiple hypotheses testing, which ranges from 0 to 1. The closer to zero, the more significant the enrichment is. (C) The top 20 KEGG enrichment analyses of DEGs in ethylene and salt responses of quinoa. The y-axis indicates the number of DEGs, and the x-axis shows the processes/components in different functions.

