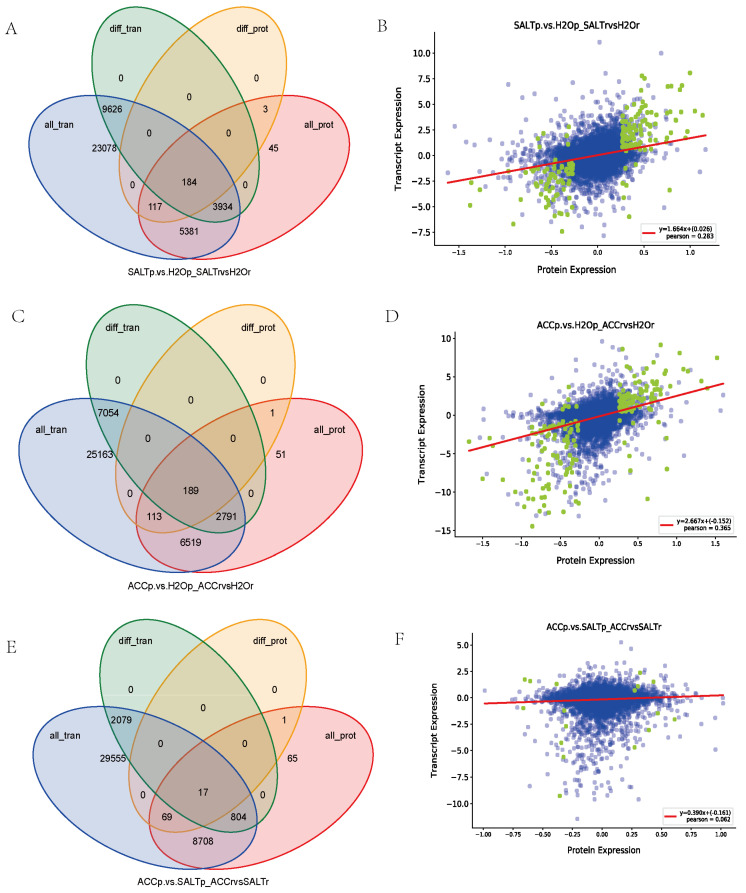
Figure 3.
The correlation analysis between proteome and transcriptome by Venn diagrams and scatter plot of expression correlation. (A,C,E) tVenn diagrams of genes, proteins, DEGs, and DEPs between SALT and H2O samples (A), between ACC and H2O samples (C), and between ACC and SALT samples (E), respectively; all_tran represents all the genes obtained from the transcriptome, diff_tran represents the DEGs identified by transcriptome, all_prot represents all the proteins identified by proteome, and diff_prot represents the DEPs identified by proteome. (B,D,F) Scatter plots of expression correlation between SALT and H2O samples (B) between ACC and H2O samples (D) and between ACC and SALT samples (F), respectively. The abscissa is the differential multiple of proteins, the ordinate is the differential multiple of corresponding genes, and the correlation coefficient and p value of the transcriptome and proteome are also shown in the figures. The points represent proteins/genes: the blue points represent non-differential proteins/genes, and the green points represent DEPs/DEGs.

