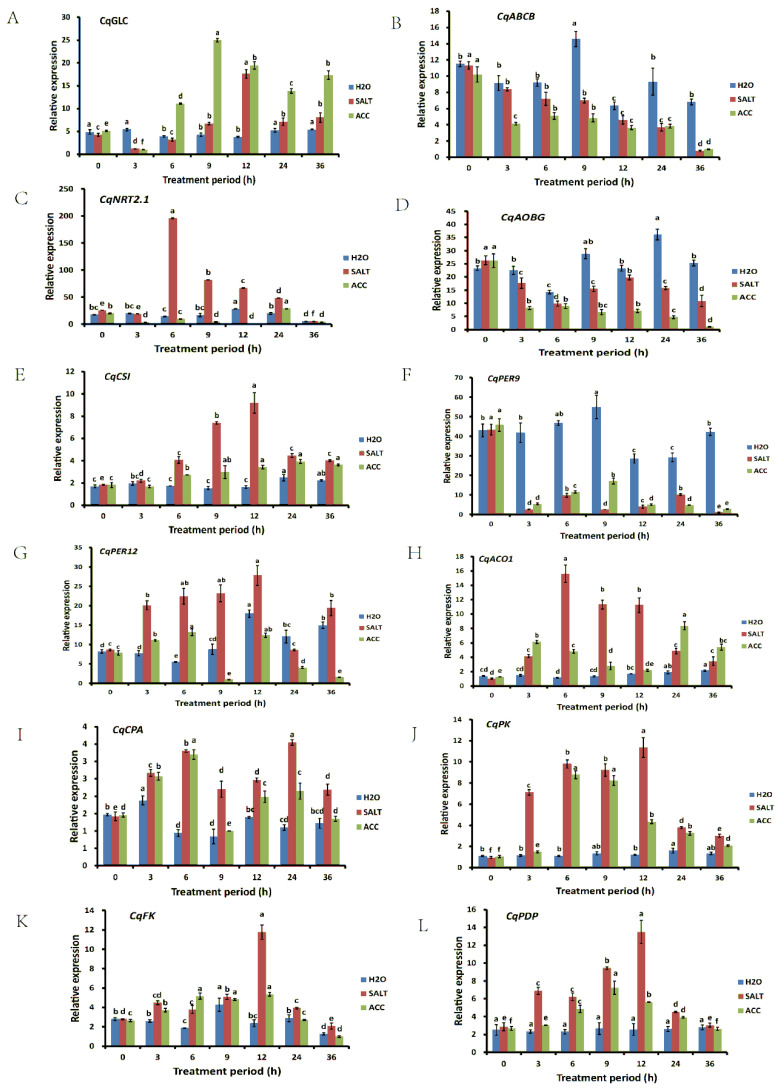
Figure 4.
Gene expression verification by qRT-PCR. The expressions of CqGLC (A), CqABCB (B), CqNRT2.1 (C), CqAOBG (D), CqCSI (E), CqPER9 (F), CqPER12 (G), CqACO1 (H), CqCPA (I), CqPK (J), CqFK (K), and CqPDP (L) were detected under different treatments with different treatment periods. The differences between samples at different treatment periods were analyzed, and the statistical significance of the difference was confirmed by ANOVA at α = 0.05 level.

