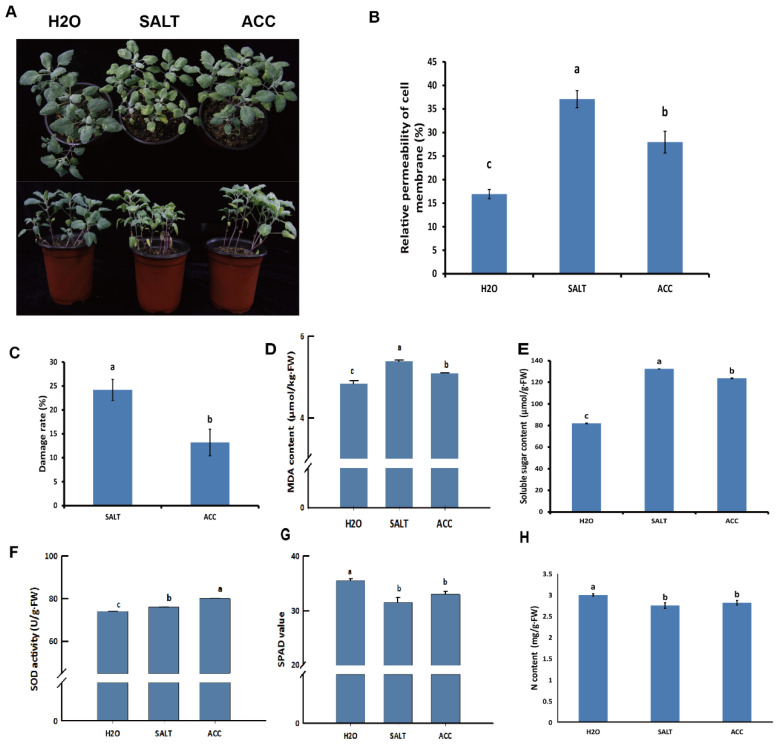
Figure 5.
Detection of physiological changes of quinoa seedlings with different treatments. The treated quinoa seedlings were photographed (A), and the relative permeability of cell membrane (B), damage rate of leaves (C), MDA content (D), soluble sugar level (E), SOD activity (F), SPAD value (G), and nitrogen level (H) of quinoa seedlings were detected. The statistical significance of the difference was analyzed by ANOVA at α = 0.05 level.

