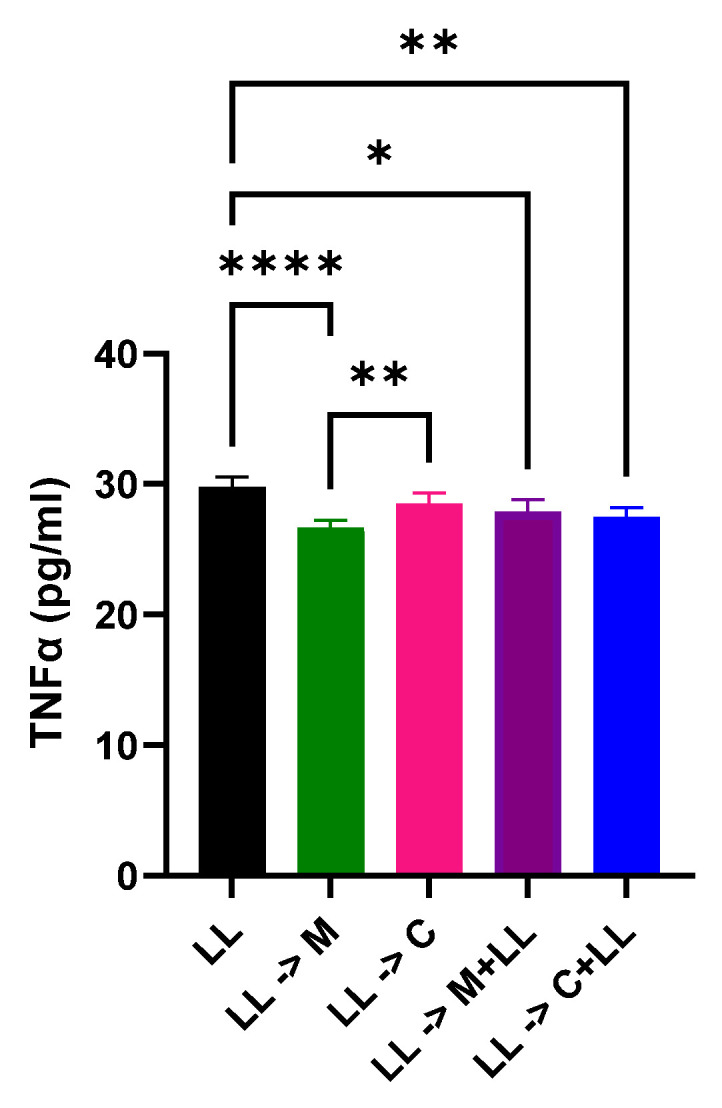
Figure 6.

TNFα ELISA. Comparison of TNFα (pg/mL) under different treatment conditions. After 72 h stimulation of Cal 27 cells with LPS + LTA, Cal 27 cells were treated with drugs for 24 h in the absence or presence of bacterial antigens. M: ML218 HCl, C: capsaicin [3], LL = LPS + LTA. Letter before the arrow represents pre-stimulation, e.g., LL-> M is LL pre-stimulation and then treatment with ML218 HCl. * p ≤ 0.05, ** p ≤ 0.01, **** p ≤ 0.0001 is statistically significant. n = nine biological replicates. Error bars represent standard error of the mean. All of the columns look rather the same although they are mathematically different.
