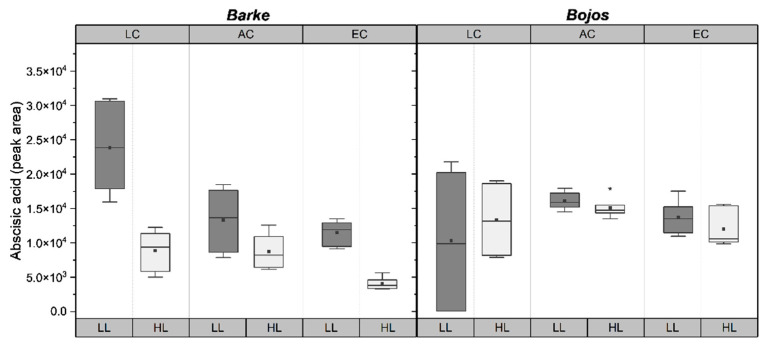
Figure 4.
Boxplots showing differences in peak area abscisic acid measured in barley genotypes, Barke (left) and Bojos (right). LC = low [CO2], AC = ambient [CO2], EC = elevated [CO2]; LL = low light (dark grey boxes), HL = high light (light grey boxes). Medians (central line), means (black squares), 25 and 75 percentiles (boxes), 1.5 interquartile range (error bars), and outliers (stars) are presented (n = 6).

