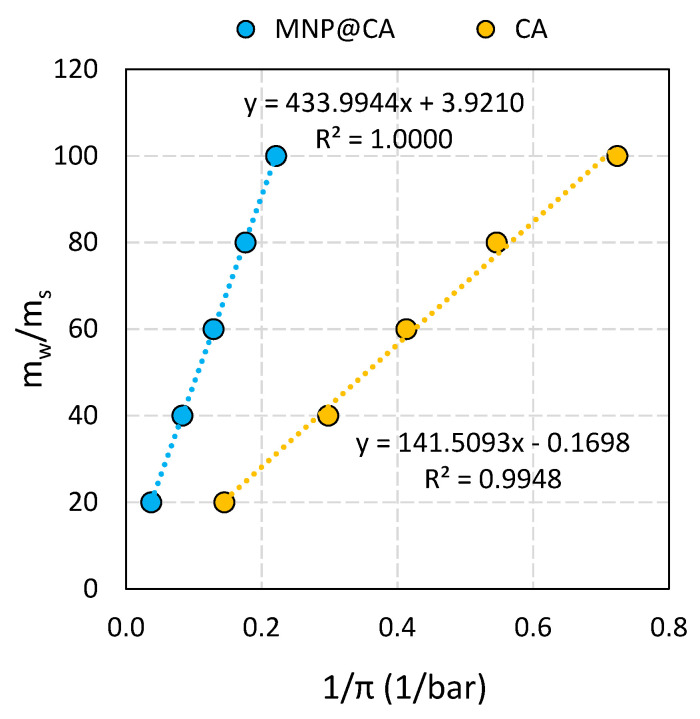
Figure 7.
Non-ideality analysis of neat CA (orange) and MNP@CA nanocomposites (blue). mW and mS: mass of water and mass of solute, π: osmotic pressure. Dashed lines represent fits to Equation (8) (r > 0.995) and fitting parameters are given in Table 4.

