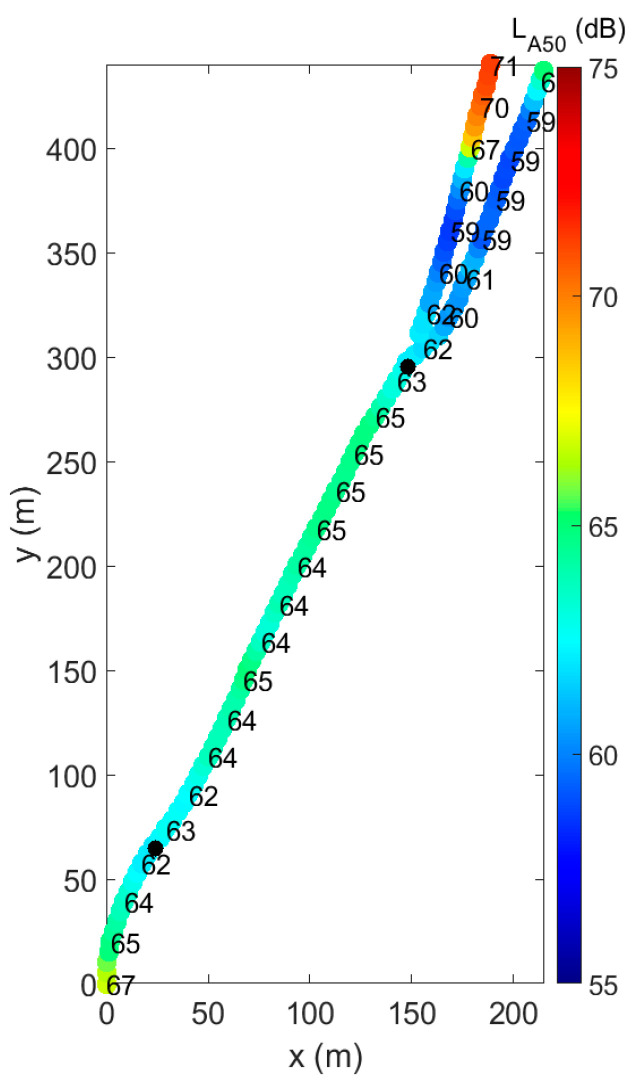
Figure 2.
Spatial distribution of the sound pressure levels measured along the cycling path, using the LA,50 indicator during daytime hours in the week when the questionnaires were held. Distances are referenced to the bottom left position (x,y) = (0,0). The survey points are marked by the two black dots.

